
Videos
A sample of the data provided in the Microsoft Excel file EnergyData.xlsx online follows. The file contains energy consumption data by energy source per year in the United States, measured in petaBTUs.
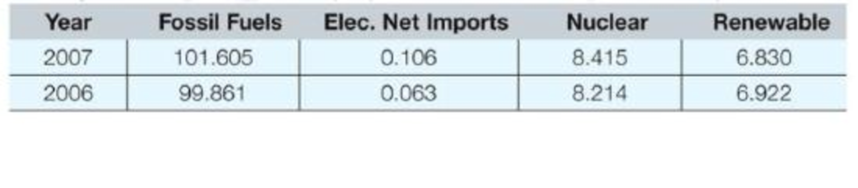
a. Write the MATLAB code necessary to read the Microsoft Excel file and store each column of data into different variables. Create the following:
- Yr: A vector of all of the years in the worksheet.
- FF: A vector of all of the fossil fuels for each year in Yr.
- ENI: A vector of all electric imports for each year in Yr.
- Nuc: A vector of all nuclear energy consumption for each year in Yr.
- Ren: A vector of all renewable energy consumption for each year in Yr.
- Hdr: A cell array of all of the headers in row 1.
You may not hard-code these variables—they should be imported from the Excel file.
b. Create a new variable. Totalconsumption, which contains the sum of the four columns of energy consumption data for each year. In other words, since all five of the
c. Calculate the average fossil fuel consumption in the entire data set. For this code, you may assume that you have correctly defined FF, the variable containing the fossil fuel consumption data, in part (a). Display the result of the calculation in the following format, where the number is shown to two decimal places:
The average fossil fuel consumption is _____ petaBTU.
Want to see the full answer?
Check out a sample textbook solution
Chapter 18 Solutions
Thinking Like an Engineer: An Active Learning Approach (3rd Edition)


- The uniform rods have a mass per unit length of 10kg/m . (Figure 1)If the dashpot has a damping coefficient of c=50N⋅s/m , and the spring has a stiffness of k=600N/m , show that the system is underdamped, and then find the pendulum's period of oscillation.arrow_forward10-50. The principal plane stresses and associated strains in a plane at a point are σ₁ = 30 ksi, σ₂ = -10 ksi, e₁ = 1.14(10-3), €2=-0.655(103). Determine the modulus of elasticity and Poisson's ratio. emps to plum... Wednesday FI a וח 2 Q Search 48 F5 - F6 4+ F7 FB F9 FIO FII F12 & * S 6 7 8 9 ㅁ F2 # *F3 3 $ 4 F4 % W E R T Y ப S ALT D F G H X C V B N J Σ H L ว { P [ ] ALT " DELETE BACKSPACE NUM LOCK T 7 HOME ENTER 4 PAUSE SHIFT CTRL Earrow_forward10−9. The state of strain at the point has components of ϵx = −100(10−6), ϵy = −200(10−6), and γxy=100(10−6). Use the strain transformation equations to determine (a) the in-plane principal strains and (b) the maximum in-plane shear strain and average normal strain. In each case specify the orientation of the element and show how the strains deform the element within the x−y plane.arrow_forward
- The strain gage is placed on the surface of the steel boiler as shown. If it is 0.5 in. long, determine the pressure in the boiler when the gage elongates 0.2(10−3) in. The boiler has a thickness of 0.5 in. and inner diameter of 60 in. Also, determine the maximum x, y in-plane shear strain in the material. Take Est=29(103)ksi, vst=0.3.arrow_forward(read image, answer given)arrow_forward6/86 The connecting rod AB of a certain internal-combustion engine weighs 1.2 lb with mass center at G and has a radius of gyration about G of 1.12 in. The piston and piston pin A together weigh 1.80 lb. The engine is running at a constant speed of 3000 rev/min, so that the angular velocity of the crank is 3000(2)/60 = 100л rad/sec. Neglect the weights of the components and the force exerted by the gas in the cylinder compared with the dynamic forces generated and calculate the magnitude of the force on the piston pin A for the crank angle 0 = 90°. (Suggestion: Use the alternative moment relation, Eq. 6/3, with B as the moment center.) Answer A = 347 lb 3" 1.3" B 1.7" PROBLEM 6/86arrow_forward
- 6/85 In a study of head injury against the instrument panel of a car during sudden or crash stops where lap belts without shoulder straps or airbags are used, the segmented human model shown in the figure is analyzed. The hip joint O is assumed to remain fixed relative to the car, and the torso above the hip is treated as a rigid body of mass m freely pivoted at O. The center of mass of the torso is at G with the initial position of OG taken as vertical. The radius of gyration of the torso about O is ko. If the car is brought to a sudden stop with a constant deceleration a, determine the speed v relative to the car with which the model's head strikes the instrument panel. Substitute the values m = 50 kg, 7 = 450 mm, r = 800 mm, ko = 550 mm, 0 = 45°, and a = 10g and compute v. Answer v = 11.73 m/s PROBLEM 6/85arrow_forwardUsing AutoCADarrow_forward340 lb 340 lb Δarrow_forward
- 4. In a table of vector differential operators, look up the expressions for V x V in a cylindrical coordinate system. (a) Compute the vorticity for the flow in a round tube where the velocity profile is = vo [1-(³] V₂ = Vo (b) Compute the vorticity for an ideal vortex where the velocity is Ve= r where constant. 2πг (c) Compute the vorticity in the vortex flow given by Ve= r 2лг 1- exp ( r² 4vt (d) Sketch all the velocity and vorticity profiles.arrow_forwardIn the figure, Neglects the heat loss and kinetic and potential energy changes, calculate the work produced by the turbine in kJ T = ??? Steam at P=3 MPa, T = 280°C Turbine Rigid tank V = 1000 m³ Turbine Rigid tank V = 100 m³ V = 1000 m³ V = 100 m³ The valve is opened. Initially: evacuated (empty) tank O a. 802.8 Initially: Closed valve O b. 572 O c. 159.93 Od. 415 e. 627.76 equilibriumarrow_forwardPlease find the torsional yield strength, the yield strength, the spring index, and the mean diameter. Use: E = 28.6 Mpsi, G = 11.5 Mpsi, A = 140 kpsi·in, m = 0.190, and relative cost= 1.arrow_forward
 Elements Of ElectromagneticsMechanical EngineeringISBN:9780190698614Author:Sadiku, Matthew N. O.Publisher:Oxford University Press
 Mechanics of Materials (10th Edition)Mechanical EngineeringISBN:9780134319650Author:Russell C. HibbelerPublisher:PEARSON
 Thermodynamics: An Engineering ApproachMechanical EngineeringISBN:9781259822674Author:Yunus A. Cengel Dr., Michael A. BolesPublisher:McGraw-Hill Education
 Control Systems EngineeringMechanical EngineeringISBN:9781118170519Author:Norman S. NisePublisher:WILEY
 Mechanics of Materials (MindTap Course List)Mechanical EngineeringISBN:9781337093347Author:Barry J. Goodno, James M. GerePublisher:Cengage Learning
 Engineering Mechanics: StaticsMechanical EngineeringISBN:9781118807330Author:James L. Meriam, L. G. Kraige, J. N. BoltonPublisher:WILEY