
Concept explainers
Videos
Three recent college graduates have formed a
a. Draw the precedence diagram.
b. What is the probability that the project can be completed in 24 days or less? In 21 days or less?
c. Suppose it is now the end of the seventh day and that activities A and B have been completed while activity D is 50 percent completed. Time estimates for the completion of activity D are 5, 6, and 7. Activities C and H are ready to begin. Determine the probability of finishing the project by day 24 and the probability of finishing by day 21.
d. The partners have decided that shortening the project by two days would be beneficial, as long as it doesn’t cost more than about $20,000. They have estimated the daily crashing costs for each activity in thousands, as shown in the following table. Which activities should be crashed, and what further analysis would they probably want to do?
a)
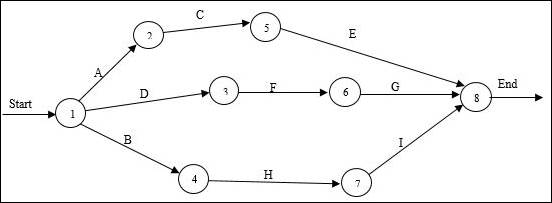
To draw: A precedence diagram.
Answer to Problem 7P
Precedence diagram:
Explanation of Solution
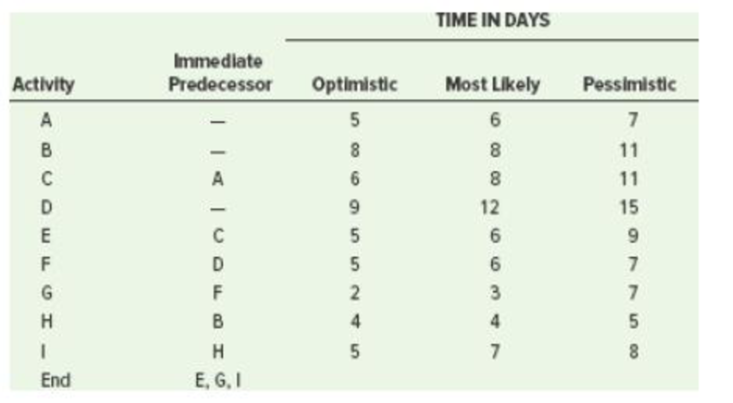
Given information:
| Activity | Immediate Predecessor | Optimistic time | Most likely time | Pessimistic time |
| A | 5 | 6 | 7 | |
| B | 8 | 8 | 11 | |
| C | A | 6 | 8 | 11 |
| D | 9 | 12 | 15 | |
| E | C | 5 | 6 | 9 |
| F | D | 5 | 6 | 7 |
| G | F | 2 | 3 | 7 |
| H | B | 4 | 4 | 5 |
| I | H | 5 | 7 | 8 |
| End | E, G, I |
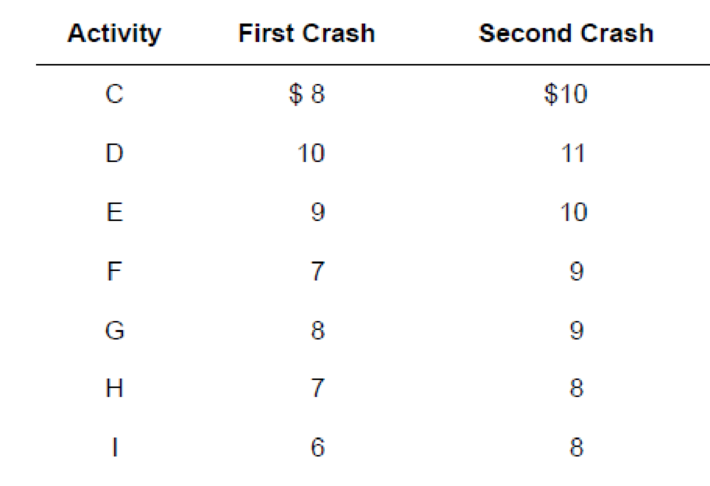
| Activity | First crash | Second crash |
| C | $ 8.00 | $ 10.00 |
| D | $ 10.00 | $ 11.00 |
| E | $ 9.00 | $ 10.00 |
| F | $ 7.00 | $ 9.00 |
| G | $ 8.00 | $ 9.00 |
| H | $ 7.00 | $ 8.00 |
| I | $ 6.00 | $ 8.00 |
Precedence diagram:
The precedence diagram is drawn from the first task till the last task. The activities are placed from left to right. The directions are represented with arrows to indicate the relationship between activities. The arrows are represented with the activity name.
b)
To determine: The probability at which the projected can be completed in 24 days or less and 21 days or less.
Answer to Problem 7P
24 days or less = 0.9686
21 days or less = 0.2350
Explanation of Solution
Given information:
| Activity | Immediate Predecessor | Optimistic time | Most likely time | Pessimistic time |
| A | 5 | 6 | 7 | |
| B | 8 | 8 | 11 | |
| C | A | 6 | 8 | 11 |
| D | 9 | 12 | 15 | |
| E | C | 5 | 6 | 9 |
| F | D | 5 | 6 | 7 |
| G | F | 2 | 3 | 7 |
| H | B | 4 | 4 | 5 |
| I | H | 5 | 7 | 8 |
| End | E, G, I |
| Activity | First crash | Second crash |
| C | $ 8.00 | $ 10.00 |
| D | $ 10.00 | $ 11.00 |
| E | $ 9.00 | $ 10.00 |
| F | $ 7.00 | $ 9.00 |
| G | $ 8.00 | $ 9.00 |
| H | $ 7.00 | $ 8.00 |
| I | $ 6.00 | $ 8.00 |
Formula to calculate expected time and variance:
Calculation of expected time and variance:
| Activity | Optimistic time | Most likely time | Pessimistic time | Expected time | Standard deviation | Variance |
| A | B | C | (A+(4*B)+C)/6 | (C-A)/6 | (C-A)^2/6^2 | |
| A | 5 | 6 | 7 | 6 | 0.333 | 0.111 |
| B | 8 | 8 | 11 | 8.5 | 0.500 | 0.250 |
| C | 6 | 8 | 11 | 8.17 | 0.833 | 0.694 |
| D | 9 | 12 | 15 | 12 | 1.000 | 1.000 |
| E | 5 | 6 | 9 | 6.33 | 0.667 | 0.444 |
| F | 5 | 6 | 7 | 6 | 0.333 | 0.111 |
| G | 2 | 3 | 7 | 3.5 | 0.833 | 0.694 |
| H | 4 | 4 | 5 | 4.17 | 0.167 | 0.028 |
| I | 5 | 7 | 8 | 6.83 | 0.500 | 0.250 |
Calculation of expected duration, variance and standard deviation for each path:
A-C-E:
D-F-G:
B-H-I:
Calculation of z value for all paths:
Formula:
24 days or less:
A-C-E:
Since z value is greater than +3.00, probability of completion is 1.00.
D-F-G:
From the standard normal distribution table,
The probability value for (z = 1.86) is 0.9686.
B-H-I:
Since z value is greater than +3.00, probability of completion is 1.00.
Probability of completion in 24 days or less:
The probability at which the project can be completed in 24 days or less is 0.9686.
21 days or less:
A-C-E:
From the standard normal distribution table,
The probability value for (z = 0.45) is 0.6736.
D-F-G:
From the standard normal distribution table,
The probability value for (z = -0.37) is 0.3557.
B-H-I:
From the standard normal distribution table,
The probability value for (z = 2.07) is 0.9808.
Probability of completion in 21 days or less:
The probability at which the project can be completed in 21 days or less is 0.2350.
c)
To determine: The probability of completing the project by day 24 and day 21.
Answer to Problem 7P
Day 24 = 0.9328
Day 21 = 0.0186
Explanation of Solution
Given information:
- At the end of 7th day activities A and B are completed and D is 50% completed.
- Time estimates of activity D completion are 5, 6 and 7.
- Activities C and H are ready to begin.
| Activity | Immediate Predecessor | Optimistic time | Most likely time | Pessimistic time |
| A | 5 | 6 | 7 | |
| B | 8 | 8 | 11 | |
| C | A | 6 | 8 | 11 |
| D | 5 | 6 | 7 | |
| E | C | 5 | 6 | 9 |
| F | D | 5 | 6 | 7 |
| G | F | 2 | 3 | 7 |
| H | B | 4 | 4 | 5 |
| I | H | 5 | 7 | 8 |
| End | E, G, I |
| Activity | First crash | Second crash |
| C | $ 8.00 | $ 10.00 |
| D | $ 10.00 | $ 11.00 |
| E | $ 9.00 | $ 10.00 |
| F | $ 7.00 | $ 9.00 |
| G | $ 8.00 | $ 9.00 |
| H | $ 7.00 | $ 8.00 |
| I | $ 6.00 | $ 8.00 |
Formula to calculate expected time and variance:
Calculation of expected time and variance:
| Activity | Optimistic time | Most likely time | Pessimistic time | Expected time | Standard deviation | Variance |
| A | B | C | (A+(4*B)+C)/6 | (C-A)/6 | (C-A)^2/6^2 | |
| A | 5 | 6 | 7 | 6 | 0.333 | 0.111 |
| B | 8 | 8 | 11 | 8.5 | 0.500 | 0.250 |
| C | 6 | 8 | 11 | 8.17 | 0.833 | 0.694 |
| D | 5 | 6 | 7 | 6 | 0.333 | 0.111 |
| E | 5 | 6 | 9 | 6.33 | 0.667 | 0.444 |
| F | 5 | 6 | 7 | 6 | 0.333 | 0.111 |
| G | 2 | 3 | 7 | 3.5 | 0.833 | 0.694 |
| H | 4 | 4 | 5 | 4.17 | 0.167 | 0.028 |
| I | 5 | 7 | 8 | 6.83 | 0.500 | 0.250 |
Revised project diagram:
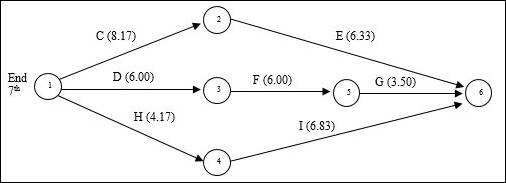
Calculation of expected duration, variance and standard deviation for each path:
C-E:
D-F-G:
H-I:
Calculation of z value for all paths:
Formula:
24 days or less:
C-E:
From the standard normal distribution table,
The probability value for (z = 2.34) is 0.9904.
D-F-G:
From the standard normal distribution table,
The probability value for (z = 1.57) is 0.9418.
H-I:
Since z value is greater than +3.00, probability of completion is 1.00.
Probability of completion in 24 days or less:
The probability at which the project can be completed in 24 days is 0.9328.
21 days or less:
C-E:
From the standard normal distribution table,
The probability value for (z = -0.47) is 0.3192.
D-F-G:
From the standard normal distribution table,
The probability value for (z = -1.57) is 0.0582.
H-I:
Since z value is greater than +3.00, probability of completion is 1.00.
Probability of completion in 21 days or less:
The probability at which the project can be completed in 21 days is 0.0186.
d)
To determine: The activities that should be crashed and further analysis.
Explanation of Solution
Given information:
- The partners want to shorten the project by 2 days as long as the cost is not more than $20,000.
| Activity | Immediate Predecessor | Optimistic time | Most likely time | Pessimistic time |
| A | 5 | 6 | 7 | |
| B | 8 | 8 | 11 | |
| C | A | 6 | 8 | 11 |
| D | 5 | 6 | 7 | |
| E | C | 5 | 6 | 9 |
| F | D | 5 | 6 | 7 |
| G | F | 2 | 3 | 7 |
| H | B | 4 | 4 | 5 |
| I | H | 5 | 7 | 8 |
| End | E, G, I |
| Activity | First crash | Second crash |
| C | $ 8.00 | $ 10.00 |
| D | $ 10.00 | $ 11.00 |
| E | $ 9.00 | $ 10.00 |
| F | $ 7.00 | $ 9.00 |
| G | $ 8.00 | $ 9.00 |
| H | $ 7.00 | $ 8.00 |
| I | $ 6.00 | $ 8.00 |
Paths and expected duration:
| Paths | Expected Duration |
| C-E | 21.50 |
| D-F-G | 22.50 |
| H-I | 18.00 |
The critical path is D – F – G.
The activities are crashed based on the cost of crash given.
| Activity | Cost |
| F | $7 |
| G | $8 |
| D | $10 |
Step 1:
Activity F has the lowest crashing cost ($7,000) and will be crashed first for 1 day. The expected duration of D-F-G will be 21.50 days.
Step 2:
| Path | Expected Duration |
| C-E | 21.50 |
| D-F-G | 21.50 |
| H-I | 18.00 |
Now there are two critical paths C-E and D-F-G.
The critical activities are arranged in the order of low crash costs.
| Path | Activity | Cost |
| C-E | C | $8 |
| F | $9 |
| Path | Activity | Cost |
| D-F-G | D | $8 |
| F | $9 | |
| G | $10 |
One activity in each path is chosen to crash.
Activity C is crashed for 1 day since it has the lowest crashing cost ($8,000) on path C-E. The expected duration of path C-E is now 20.50 days.
Activity G is crashed for 1 day since it has the lowest crashing cost ($8,000) on path D-F-G. The expected duration of path D-F-G is now 20.50 days.
Calculation of total crashing cost:
The total cost of crashing is over the budget of $20,000 ($23,000 > $20,000). Hence, the partners will have to determine if crashing the project by 1 day or 2 days is really beneficial or not.
Want to see more full solutions like this?
Chapter 17 Solutions
Loose-leaf for Operations Management (The Mcgraw-hill Series in Operations and Decision Sciences)


- Question 6. An electrical engineering company is designing two types of solar panel systems: Standard Panels (S) and High-Efficiency Panels (H). The company has certain constraints regarding the hours of labor and material available for production each week. Each Standard Panel requires 4 hours of labor and 2 units of material and each High-Efficiency Panel requires 3 hours of labor and 5 units of material. The company has a maximum of 60 hours of labor and 40 units of material available per week. The profit from each Standard Panel is GH¢80, and the profit from each High-Efficiency Panel is GH¢100. The company wants to determine how many of each type of panel to produce in order to maximize profit. i) Solve this LPP by using graphical analysis ii) What will be the slack at the optimal solution point? Show calculation.arrow_forwardqusestion 6. An electrical engineering company is designing two types of solar panel systems: Standard Panels (S) and High-Efficiency Panels (H). The company has certain constraints regarding the hours of labor and material available for production each week. Each Standard Panel requires 4 hours of labor and 2 units of material and each High-Efficiency Panel requires 3 hours of labor and 5 units of material. The company has a maximum of 60 hours of labor and 40 units of material available per week. The profit from each Standard Panel is GH¢80, and the profit from each High-Efficiency Panel is GH¢100. The company wants to determine how many of each type of panel to produce in order to maximize profit. i. Formulate a linear programming model of the problem for the company. ii Convert the linear programming model formulated in (a) to a standard form.arrow_forwardG ווח >>> Mind Tap Cengage Learning 1- CENGAGE MINDTAP Chapter 09 Excel Activity: Exponential Smoothing Question 1 3.33/10 e Submit 自 A ng.cengage.com C Excel Online Student Work G A retail store records customer demand during each sales period. 1. What is the f... Q Search this course ? ✓ Co Excel Online Tutorial Excel Online Activity: Exponential Smoothing A-Z A retail store records customer demand during each sales period. The data has been collected in the Microsoft Excel Online file below. Use the Microsoft Excel Online file below to develop the single exponential smoothing forecast and answer the following questions. Office Video X Open spreadsheet Questions 1. What is the forecast for the 13th period based on the single exponential smoothing? Round your answer to two decimal places. 25.10 2. What is the MSE for the single exponential smoothing forecast? Round your answer to two decimal places. 21.88 Activity Frame ? 3. Choose the correct graph for the single exponential…arrow_forward
- Not use ai pleasearrow_forwardItems removed from the work area (5S) were taken to a storage area called ___________. Choose from: SORT, STORD, KNUJ, STUFF, FUDG SORT STORD KNUJ STUFF FUDGarrow_forwardCould you please help explain How was the poor strategic decisions lead to economic downturns of Circuit City Company? What are the sequences of key events and problems that contribute to its collapse. Could you please explain each one them and give the examples If Circuit City would apply Lean Six Sigma. would it helped prevent businesses from collapsed?? How Qualitative and quantitative Research Methodology in Case Study Research would affect Circuit City?arrow_forward
- Apple is a global technology company renowned for its innovation and design. To create its products, Apple has established a world class global supply chain to bring their products to market. What strategies is Apple using to source and manufacture its products? How does Apple view its responsibility to its suppliers and those who build its products?arrow_forwardCritical Path Method (CPM) is an important Project Management Tool that has wide industry application in modern day Project Management. By using an example of the project of your choice, critically examine the practical application of CPM as a Project Management Tool.arrow_forwardwhat is an other difination for principle?arrow_forward
- Need help or ideas to design out two slides as my script and writing quite long to squeese into two slides. But can just point form in slides with correct title and a good script for me to present two slides in only 2.5 mins. Following is my draft, pls guide me step by step on powerpoint creation and good script to present findings. My draft: Slide 1: Foreign Labor Exploitation in Dyson's Supply Chain Introduction Dyson's former Malaysian supplier, ATA IMS Bhd, became embroiled in serious labor exploitation allegations in 2021. These concerns surfaced when whistleblowers exposed unethical labor practices affecting migrant workers, primarily from Nepal and Bangladesh. Key Forms of Exploitation Debt Bondage Due to Recruitment Fees Workers were forced to pay exorbitant recruitment fees before securing employment, often taking loans at high interest rates. This financial burden trapped them in debt bondage, leaving them with little choice but to accept exploitative working…arrow_forwardNot use ai pleasearrow_forwardThe Business Development Bank of Canada. (2023). Canadian economic outlook for 2024: Shifting into neutral. https://www.bdc.ca/en/articles-tools/blog/canadian-economic-outlook-for-2024-shifting-into-neutral “Despite persistently high inflation and rising interest rates, the news was generally better than expected for the Canadian economy in 2023” (BDC Blog 2024). Discussion Question: In your view, what are the most pressing problems for Canadian companies or consumers in 2024? Explain your answer using current examples of companies or consumer concerns.arrow_forward
 Practical Management ScienceOperations ManagementISBN:9781337406659Author:WINSTON, Wayne L.Publisher:Cengage,
 Management, Loose-Leaf VersionManagementISBN:9781305969308Author:Richard L. DaftPublisher:South-Western College Pub