
Concept explainers
PRINTED BY: 92248ddb24ccbc6@placeholder.10274.edu. Printing is for personal, private use only. No part of this book may be reproduced or transmitted without publisher's prior permission. Violators will be prosecuted.
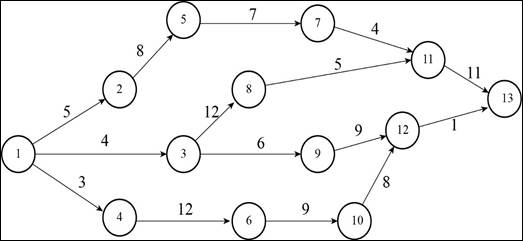
A construction project has indirect costs totaling $40,000 per week. Major activities in the project and their expected times in weeks are shown in this precedence diagram.
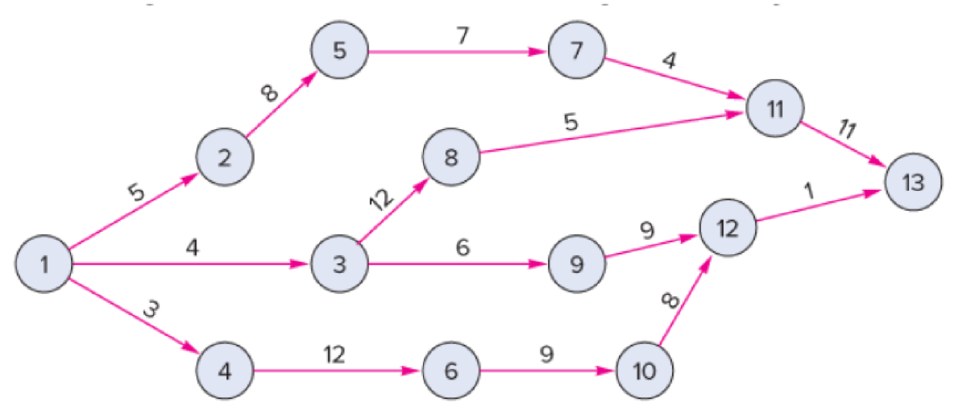
Crashing costs for each activity are:
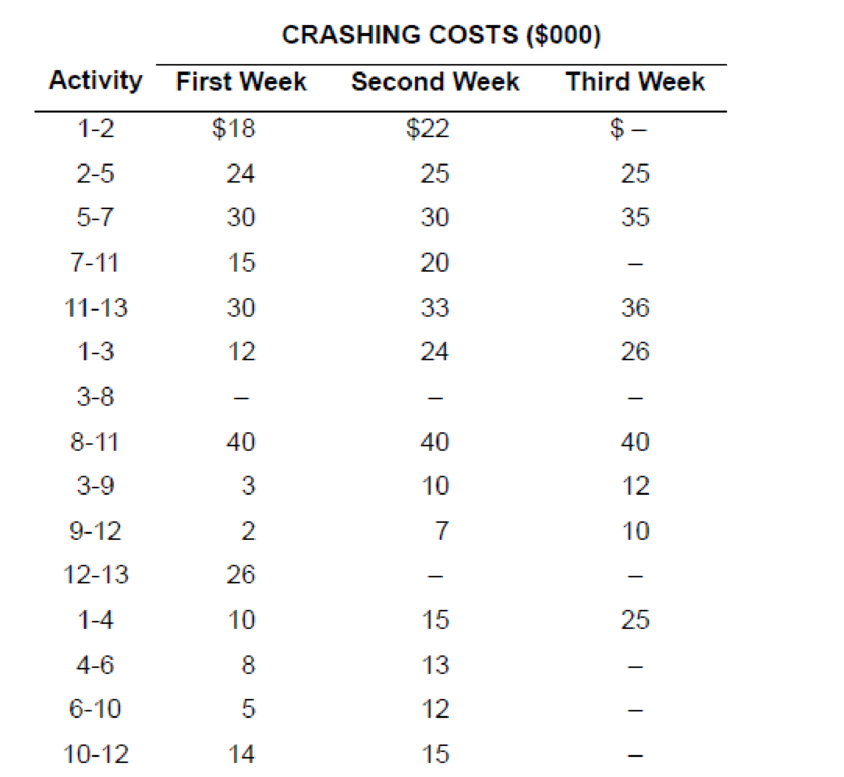
a. Determine the optimum time–cost crashing plan.
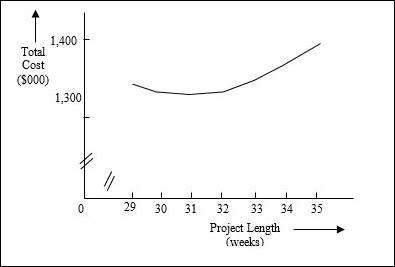
b. Plot the total-cost curve that describes the least expensive crashing
a)
To determine: The optimum cost-saving plan.
Introduction:
Project crashing:
It is method to shorten the total time taken for a project by reducing the time taken for one or more activities on the critical path. The reduction in the normal time taken is known as crashing.
Answer to Problem 15P
Explanation of Solution
Given information:
- Indirect cost is $40,000 per week.
| Activity | Crash cost first week ($000) | Crash cost second week ($000) | Crash cost third week ($000) |
| 1 to 2 | 18 | 22 | |
| 2 to 5 | 24 | 25 | 25 |
| 5 to 7 | 30 | 30 | 35 |
| 7 to 11 | 15 | 20 | |
| 11 to 13 | 30 | 33 | 36 |
| 1 to 3 | 12 | 24 | 26 |
| 3 to 8 | |||
| 8 to 11 | 40 | 40 | 40 |
| 3 to 9 | 3 | 10 | 12 |
| 9 to 12 | 2 | 7 | 10 |
| 12 to 13 | 26 | ||
| 1 to 4 | 10 | 15 | 25 |
| 4 to 6 | 8 | 13 | |
| 6 to 10 | 5 | 12 | |
| 10 to 12 | 14 | 15 |
Project crashing:
Calculation of expected duration of each path:
Path 1-2-5-7-11-13:
Path 1-3-8-11-13:
Path 1-3-9-12-13:
Path 1-4-6-10-12-13:
Step 1:
Critical path is 1-2-5-7-11-13.
The activities are ranked according to the cost per week to crash.
| Activity | Cost ($) |
| 7-11 | 15 |
| 1-2 | 18 |
| 2-5 | 24 |
| 5-7 | 30 |
| 11-13 | 30 |
Activity 7-11 will be crashed first by 1 week since it has the lowest crashing cost ($15) and this cost is ≤ 40. Path 1-2-5-7-11-13 will decrease by 1 week.
Step 2:
The paths and new expected duration are:
| Path | Expected Duration |
| 1-2-5-7-11-13 | 34 |
| 1-3-8-11-13 | 32 |
| 1-3-9-12-13 | 20 |
| 1-4-6-10-12-13 | 33 |
Critical path is 1-2-5-7-11-13.
The activities are ranked according to the cost per week to crash.
| Activity | Cost ($) |
| 1-2 | $18 |
| 7-11 | $20 |
| 2-5 | $24 |
| 5-7 | $30 |
| 11-13 | $30 |
Activity 1-2 will be crashed first by 1 week since it has the lowest crashing cost ($18) and this cost is ≤ 40. Path 1-2-5-7-11-13 will decrease by 1 week.
Step 3:
The paths and new expected duration are:
| Path | Expected Duration |
| 1-2-5-7-11-13 | 33 |
| 1-3-8-11-13 | 32 |
| 1-3-9-12-13 | 20 |
| 1-4-6-10-12-13 | 33 |
Critical path is 1-2-5-7-11-13 and 1-4-6-10-12-13.
The activities are ranked according to the cost per week to crash.
| Path | Activity | Cost ($) |
| 1-2-5-7-11-13 | 7-11 | $20 |
| 1-2 | $22 | |
| 2-5 | $24 | |
| 5-7 | $30 | |
| 11-13 | $30 | |
| 1-4-6-10-12-13 | 6-10 | $5 |
| 4-6 | $8 | |
| 1-4 | $10 | |
| 10-12 | $14 | |
| 12-13 | $26 |
Activity 7-11 will be crashed first by 1 week since it has the lowest crashing cost ($20). Path 1-2-5-7-11-13 will decrease by 1 week.
Activity 6-10 will be crashed first by 1 week since it has the lowest crashing cost ($5). Path 1-4-6-10-12-13 will decrease by 1 week.
The combined crash cost ($25) is ≤ $40.
Step 4:
The paths and new expected duration are:
| Path | Expected Duration |
| 1-2-5-7-11-13 | 32 |
| 1-3-8-11-13 | 32 |
| 1-3-9-12-13 | 20 |
| 1-4-6-10-12-13 | 32 |
Critical path is 1-2-5-7-11-13, 1-3-8-11-13, and 1-4-6-10-12-13.
The activities are ranked according to the cost per week to crash.
| Path | Activity | Cost ($) |
| 1-2-5-7-11-13 | 1-2 | $22 |
| 2-5 | $24 | |
| 5-7 | $30 | |
| 11-13 | $30 | |
| 1-3-8-11-13 | 1-3 | $12 |
| 11-13 | $30 | |
| 8-11 | $40 | |
| 1-4-6-10-12-13 | 4-6 | $8 |
| 1-4 | $10 | |
| 6-10 | $12 | |
| 10-12 | $14 | |
| 12-13 | $26 |
Activity 11-13 will be crashed first by 1 week since it has the lowest crashing cost ($30). Paths 1-2-5-7-11-13 and 1-3-8-11-13 will decrease by 1 week.
Activity 4-6 will be crashed first by 1 week since it has the lowest crashing cost ($8). Path 1-4-6-10-12-13 will decrease by 1 week.
The combined crash cost ($38) is ≤ $40.
Step 5:
The paths and new expected duration are:
| Path | Expected Duration |
| 1-2-5-7-11-13 | 31 |
| 1-3-8-11-13 | 31 |
| 1-3-9-12-13 | 20 |
| 1-4-6-10-12-13 | 31 |
Critical path is 1-2-5-7-11-13, 1-3-8-11-13, and 1-4-6-10-12-13.
The activities are ranked according to the cost per week to crash.
| Path | Activity | Cost ($) |
| 1-2-5-7-11-13 | 1-2 | $22 |
| 2-5 | $24 | |
| 5-7 | $30 | |
| 11-13 | $33 | |
| 1-3-8-11-13 | 1-3 | $12 |
| 11-13 | $33 | |
| 8-11 | $40 | |
| 1-4-6-10-12-13 | 1-4 | $10 |
| 6-10 | $12 | |
| 4-6 | $13 | |
| 10-12 | $14 | |
| 12-13 | $26 |
Activity 11-13 could be crashed first by 1 week since it has the lowest crashing cost ($33). Paths 1-2-5-7-11-13 and 1-3-8-11-13 will decrease by 1 week.
Activity 1-4 could be crashed first by 1 week since it has the lowest crashing cost ($10). Path 1-4-6-10-12-13 will decrease by 1 week.
The combined crash cost ($43) is ≥ $40.
Since the marginal cost of crashing is greater than the marginal benefit of crashing, crashing will be stopped at step 4.
The final project duration time is 31 weeks. The activities that are crashed are:
Activity 7-11 (First week)
Activity 7-11 (Second week)
Activity 1-2
Activity 6-10
Activity 11-13
Activity 4-6
Calculation of total crashing cost:
The total crashing cost is calculated by summing the crashing cost involved all the steps and the indirect costs every week.
The activities to be crashed are: 7-11, 1-2, 6-10, 11-13, and 4-6. The total crashing cost is $1,336,000.
b)
To Plot: The cost curve with the least expensive crashing which will reduce the project by 6 weeks.
Introduction:
Project crashing:
It is method to shorten the total time taken for a project by reducing the time taken for one or more activities on the critical path. The reduction in the normal time taken is known as crashing.
Answer to Problem 15P
Cost curve:
Explanation of Solution
Given information:
- Indirect cost is $40,000 per week.
| Activity | Crash cost first week ($000) | Crash cost second week ($000) | Crash cost third week ($000) |
| 1 to 2 | 18 | 22 | |
| 2 to 5 | 24 | 25 | 25 |
| 5 to 7 | 30 | 30 | 35 |
| 7 to 11 | 15 | 20 | |
| 11 to 13 | 30 | 33 | 36 |
| 1 to 3 | 12 | 24 | 26 |
| 3 to 8 | |||
| 8 to 11 | 40 | 40 | 40 |
| 3 to 9 | 3 | 10 | 12 |
| 9 to 12 | 2 | 7 | 10 |
| 12 to 13 | 26 | ||
| 1 to 4 | 10 | 15 | 25 |
| 4 to 6 | 8 | 13 | |
| 6 to 10 | 5 | 12 | |
| 10 to 12 | 14 | 15 |
Project crashing:
Calculation of expected duration of each path:
Path 1-2-5-7-11-13:
Path 1-3-8-11-13:
Path 1-3-9-12-13:
Path 1-4-6-10-12-13:
Step 1:
Critical path is 1-2-5-7-11-13.
The activities are ranked according to the cost per week to crash.
| Activity | Cost ($) |
| 7-11 | 15 |
| 1-2 | 18 |
| 2-5 | 24 |
| 5-7 | 30 |
| 11-13 | 30 |
Activity 7-11 will be crashed first by 1 week since it has the lowest crashing cost ($15) and this cost is ≤ 40. Path 1-2-5-7-11-13 will decrease by 1 week.
Step 2:
The paths and new expected duration are:
| Path | Expected Duration |
| 1-2-5-7-11-13 | 34 |
| 1-3-8-11-13 | 32 |
| 1-3-9-12-13 | 20 |
| 1-4-6-10-12-13 | 33 |
Critical path is 1-2-5-7-11-13.
The activities are ranked according to the cost per week to crash.
| Activity | Cost ($) |
| 1-2 | $18 |
| 7-11 | $20 |
| 2-5 | $24 |
| 5-7 | $30 |
| 11-13 | $30 |
Activity 1-2 will be crashed first by 1 week since it has the lowest crashing cost ($18) and this cost is ≤ 40. Path 1-2-5-7-11-13 will decrease by 1 week.
Step 3:
The paths and new expected duration are:
| Path | Expected Duration |
| 1-2-5-7-11-13 | 33 |
| 1-3-8-11-13 | 32 |
| 1-3-9-12-13 | 20 |
| 1-4-6-10-12-13 | 33 |
Critical path is 1-2-5-7-11-13 and 1-4-6-10-12-13.
The activities are ranked according to the cost per week to crash.
| Path | Activity | Cost ($) |
| 1-2-5-7-11-13 | 7-11 | $20 |
| 1-2 | $22 | |
| 2-5 | $24 | |
| 5-7 | $30 | |
| 11-13 | $30 | |
| 1-4-6-10-12-13 | 6-10 | $5 |
| 4-6 | $8 | |
| 1-4 | $10 | |
| 10-12 | $14 | |
| 12-13 | $26 |
Activity 7-11 will be crashed first by 1 week since it has the lowest crashing cost ($20). Path 1-2-5-7-11-13 will decrease by 1 week.
Activity 6-10 will be crashed first by 1 week since it has the lowest crashing cost ($5). Path 1-4-6-10-12-13 will decrease by 1 week.
The combined crash cost ($25) is ≤ $40.
Step 4:
The paths and new expected duration are:
| Path | Expected Duration |
| 1-2-5-7-11-13 | 32 |
| 1-3-8-11-13 | 32 |
| 1-3-9-12-13 | 20 |
| 1-4-6-10-12-13 | 32 |
Critical path is 1-2-5-7-11-13, 1-3-8-11-13, and 1-4-6-10-12-13.
The activities are ranked according to the cost per week to crash.
| Path | Activity | Cost ($) |
| 1-2-5-7-11-13 | 1-2 | $22 |
| 2-5 | $24 | |
| 5-7 | $30 | |
| 11-13 | $30 | |
| 1-3-8-11-13 | 1-3 | $12 |
| 11-13 | $30 | |
| 8-11 | $40 | |
| 1-4-6-10-12-13 | 4-6 | $8 |
| 1-4 | $10 | |
| 6-10 | $12 | |
| 10-12 | $14 | |
| 12-13 | $26 |
Activity 11-13 will be crashed first by 1 week since it has the lowest crashing cost ($30). Paths 1-2-5-7-11-13 and 1-3-8-11-13 will decrease by 1 week.
Activity 4-6 will be crashed first by 1 week since it has the lowest crashing cost ($8). Path 1-4-6-10-12-13 will decrease by 1 week.
The combined crash cost ($38) is ≤ $40.
Step 5:
The paths and new expected duration are:
| Path | Expected Duration |
| 1-2-5-7-11-13 | 31 |
| 1-3-8-11-13 | 31 |
| 1-3-9-12-13 | 20 |
| 1-4-6-10-12-13 | 31 |
Critical path is 1-2-5-7-11-13, 1-3-8-11-13, and 1-4-6-10-12-13.
The activities are ranked according to the cost per week to crash.
| Path | Activity | Cost ($) |
| 1-2-5-7-11-13 | 1-2 | $22 |
| 2-5 | $24 | |
| 5-7 | $30 | |
| 11-13 | $33 | |
| 1-3-8-11-13 | 1-3 | $12 |
| 11-13 | $33 | |
| 8-11 | $40 | |
| 1-4-6-10-12-13 | 1-4 | $10 |
| 6-10 | $12 | |
| 4-6 | $13 | |
| 10-12 | $14 | |
| 12-13 | $26 |
Activity 11-13 will be crashed first by 1 week since it has the lowest crashing cost ($33). Paths 1-2-5-7-11-13 and 1-3-8-11-13 will decrease by 1 week.
Activity 1-4 will be crashed first by 1 week since it has the lowest crashing cost ($10). Path 1-4-6-10-12-13 will decrease by 1 week. The combined crash cost is ($43).
Step 6:
The paths and new expected duration are:
| Path | Expected Duration |
| 1-2-5-7-11-13 | 30 |
| 1-3-8-11-13 | 30 |
| 1-3-9-12-13 | 20 |
| 1-4-6-10-12-13 | 30 |
Critical path is 1-2-5-7-11-13, 1-3-8-11-13, and 1-4-6-10-12-13.
The activities are ranked according to the cost per week to crash.
| Path | Activity | Cost ($) |
| 1-2-5-7-11-13 | 1-2 | $22 |
| 2-5 | $24 | |
| 5-7 | $30 | |
| 11-13 | $36 | |
| 1-3-8-11-13 | 1-3 | $12 |
| 11-13 | $36 | |
| 8-11 | $40 | |
| 1-4-6-10-12-13 | 6-10 | $12 |
| 4-6 | $13 | |
| 10-12 | $14 | |
| 1-4 | $15 | |
| 12-13 | $26 |
Activity 1-2 will be crashed first by 1 week since it has the lowest crashing cost ($22). Path 1-2-5-7-11-13 will decrease by 1 week.
Activity 1-3 will be crashed first by 1 week since it has the lowest crashing cost ($12). Path 1-3-8-11-13 will decrease by 1 week.
Activity 6-10 will be crashed first by 1 week since it has the lowest crashing cost ($12). Path 1-4-6-10-12-13 will decrease by 1 week. The combined crash cost is ($436.
The final project duration time is 29 weeks. The activities that are crashed are:
Activity 7-11 (First week)
Activity 7-11 (Second week)
Activity 1-2 (First week)
Activity 1-2 (Second week)
Activity 11-13 (First week)
Activity 11-13 (Second week)
Activity 4-6
Activity 6-10
Activity 1-4
Activity 1-3
Calculation of total crashing cost:
The total crashing cost is calculated by summing the crashing cost involved all the steps and the indirect costs every week.
Summarization of total costs for different project lengths:
| Project Length | Cumulative Weeks shortened | Cumulative crash cost ($000) | Indirect cost ($000) | Total cost ($000) |
| A | B | C |
|
E = C+D |
| 35 | 0 | $ - | $ 1,400.00 | $ 1,400.00 |
| 34 | 1 | $ 15.00 | $ 1,360.00 | $ 1,375.00 |
| 33 | 2 | $ 33.00 | $ 1,320.00 | $ 1,353.00 |
| 32 | 3 | $ 58.00 | $ 1,280.00 | $ 1,338.00 |
| 31 | 4 | $ 96.00 | $ 1,240.00 | $ 1,336.00 |
| 30 | 5 | $ 139.00 | $ 1,200.00 | $ 1,339.00 |
| 29 | 6 | $ 185.00 | $ 1,160.00 | $ 1,345.00 |
Cost curve:
The cost curve is plotted by taking the project length on the X-axis and the total cost on the Y-axis.

Want to see more full solutions like this?
Chapter 17 Solutions
Loose-leaf for Operations Management (The Mcgraw-hill Series in Operations and Decision Sciences)
- Could you please help explain How was the poor strategic decisions lead to economic downturns of Circuit City Company? What are the sequences of key events and problems that contribute to its collapse. Could you please explain each one them and give the examples If Circuit City would apply Lean Six Sigma. would it helped prevent businesses from collapsed?? How Qualitative and quantitative Research Methodology in Case Study Research would affect Circuit City?arrow_forwardApple is a global technology company renowned for its innovation and design. To create its products, Apple has established a world class global supply chain to bring their products to market. What strategies is Apple using to source and manufacture its products? How does Apple view its responsibility to its suppliers and those who build its products?arrow_forwardCritical Path Method (CPM) is an important Project Management Tool that has wide industry application in modern day Project Management. By using an example of the project of your choice, critically examine the practical application of CPM as a Project Management Tool.arrow_forward
- what is an other difination for principle?arrow_forwardNeed help or ideas to design out two slides as my script and writing quite long to squeese into two slides. But can just point form in slides with correct title and a good script for me to present two slides in only 2.5 mins. Following is my draft, pls guide me step by step on powerpoint creation and good script to present findings. My draft: Slide 1: Foreign Labor Exploitation in Dyson's Supply Chain Introduction Dyson's former Malaysian supplier, ATA IMS Bhd, became embroiled in serious labor exploitation allegations in 2021. These concerns surfaced when whistleblowers exposed unethical labor practices affecting migrant workers, primarily from Nepal and Bangladesh. Key Forms of Exploitation Debt Bondage Due to Recruitment Fees Workers were forced to pay exorbitant recruitment fees before securing employment, often taking loans at high interest rates. This financial burden trapped them in debt bondage, leaving them with little choice but to accept exploitative working…arrow_forwardNot use ai pleasearrow_forward
- The Business Development Bank of Canada. (2023). Canadian economic outlook for 2024: Shifting into neutral. https://www.bdc.ca/en/articles-tools/blog/canadian-economic-outlook-for-2024-shifting-into-neutral “Despite persistently high inflation and rising interest rates, the news was generally better than expected for the Canadian economy in 2023” (BDC Blog 2024). Discussion Question: In your view, what are the most pressing problems for Canadian companies or consumers in 2024? Explain your answer using current examples of companies or consumer concerns.arrow_forwardhow have idividual objectives led to the current situation at TeraCog? what should Emaa do?arrow_forwardCan you write me an email about addressing an issue to mentor my supervisor the right way of deligating operations dutiesarrow_forward
- Can you right me an email about addressing an issue to mentor the right why of deligating operations dutiesarrow_forwardDefine delegation. Discuss in detail the four reasons why managers do delegation? Also statethe four main types of delegation.arrow_forwardB) Going forward, is Lean/JIT worth the risks? Should it be embraced (why?), abandoned (if so, why & what are the costs), or modified (how?) Do you think Lean works or not? Please write a complete response (about 1-2 paragraphs each part). Each team member should discuss and contribute so that the group agrees on their joint response. Please help each other and build upon and/or challenge others' points (in a respectful way!)arrow_forward
 Practical Management ScienceOperations ManagementISBN:9781337406659Author:WINSTON, Wayne L.Publisher:Cengage,


