
Concept explainers
Videos
PRINTED BY: 92248ddb24ccbc6@placeholder.10274.edu. Printing is for personal, private use only. No part of this book may be reproduced or transmitted without publisher's prior permission. Violators will be prosecuted.
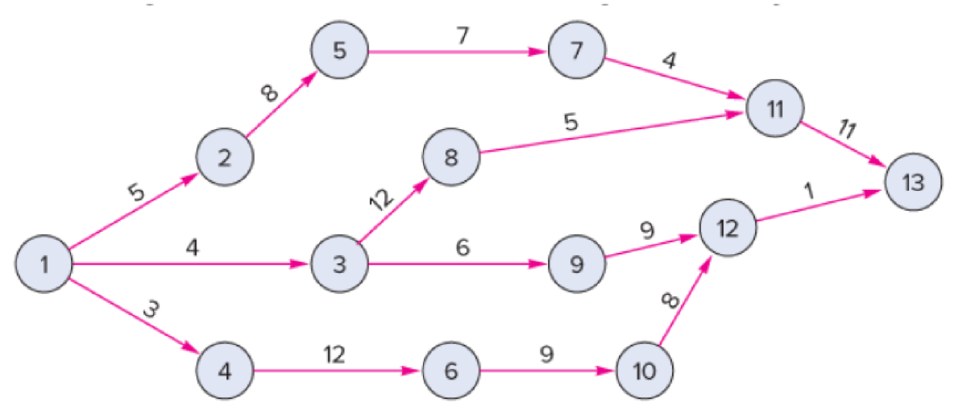
A construction project has indirect costs totaling $40,000 per week. Major activities in the project and their expected times in weeks are shown in this precedence diagram.
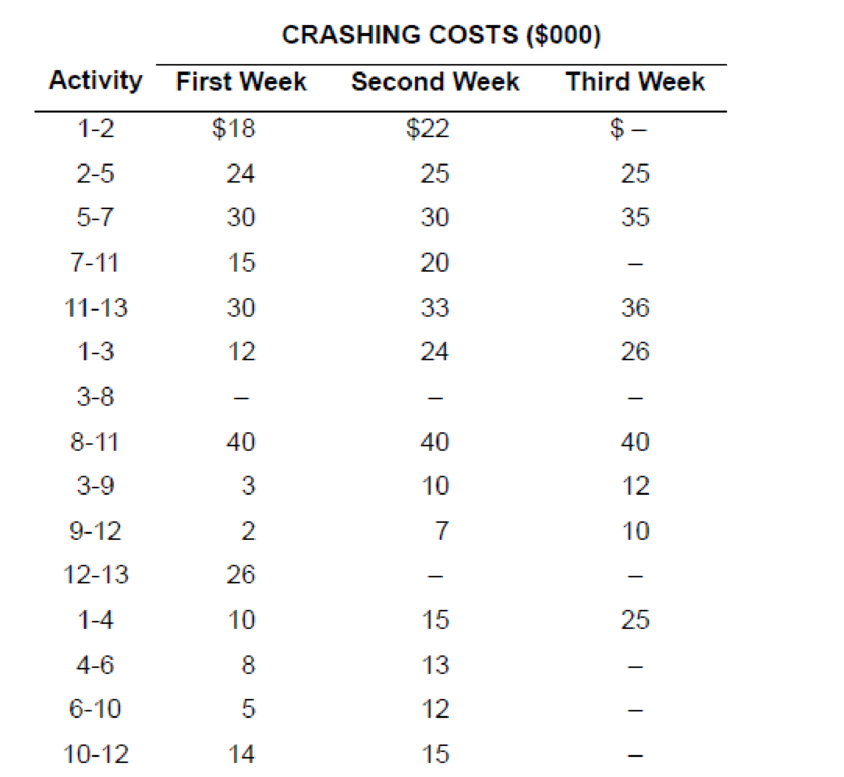
Crashing costs for each activity are:
a. Determine the optimum time–cost crashing plan.
b. Plot the total-cost curve that describes the least expensive crashing
a)
To determine: The optimum cost-saving plan.
Introduction:
Project crashing:
It is method to shorten the total time taken for a project by reducing the time taken for one or more activities on the critical path. The reduction in the normal time taken is known as crashing.
Answer to Problem 15P
Explanation of Solution
Given information:
- Indirect cost is $40,000 per week.
| Activity | Crash cost first week ($000) | Crash cost second week ($000) | Crash cost third week ($000) |
| 1 to 2 | 18 | 22 | |
| 2 to 5 | 24 | 25 | 25 |
| 5 to 7 | 30 | 30 | 35 |
| 7 to 11 | 15 | 20 | |
| 11 to 13 | 30 | 33 | 36 |
| 1 to 3 | 12 | 24 | 26 |
| 3 to 8 | |||
| 8 to 11 | 40 | 40 | 40 |
| 3 to 9 | 3 | 10 | 12 |
| 9 to 12 | 2 | 7 | 10 |
| 12 to 13 | 26 | ||
| 1 to 4 | 10 | 15 | 25 |
| 4 to 6 | 8 | 13 | |
| 6 to 10 | 5 | 12 | |
| 10 to 12 | 14 | 15 |
Project crashing:
Calculation of expected duration of each path:
Path 1-2-5-7-11-13:
Path 1-3-8-11-13:
Path 1-3-9-12-13:
Path 1-4-6-10-12-13:
Step 1:
Critical path is 1-2-5-7-11-13.
The activities are ranked according to the cost per week to crash.
| Activity | Cost ($) |
| 7-11 | 15 |
| 1-2 | 18 |
| 2-5 | 24 |
| 5-7 | 30 |
| 11-13 | 30 |
Activity 7-11 will be crashed first by 1 week since it has the lowest crashing cost ($15) and this cost is ≤ 40. Path 1-2-5-7-11-13 will decrease by 1 week.
Step 2:
The paths and new expected duration are:
| Path | Expected Duration |
| 1-2-5-7-11-13 | 34 |
| 1-3-8-11-13 | 32 |
| 1-3-9-12-13 | 20 |
| 1-4-6-10-12-13 | 33 |
Critical path is 1-2-5-7-11-13.
The activities are ranked according to the cost per week to crash.
| Activity | Cost ($) |
| 1-2 | $18 |
| 7-11 | $20 |
| 2-5 | $24 |
| 5-7 | $30 |
| 11-13 | $30 |
Activity 1-2 will be crashed first by 1 week since it has the lowest crashing cost ($18) and this cost is ≤ 40. Path 1-2-5-7-11-13 will decrease by 1 week.
Step 3:
The paths and new expected duration are:
| Path | Expected Duration |
| 1-2-5-7-11-13 | 33 |
| 1-3-8-11-13 | 32 |
| 1-3-9-12-13 | 20 |
| 1-4-6-10-12-13 | 33 |
Critical path is 1-2-5-7-11-13 and 1-4-6-10-12-13.
The activities are ranked according to the cost per week to crash.
| Path | Activity | Cost ($) |
| 1-2-5-7-11-13 | 7-11 | $20 |
| 1-2 | $22 | |
| 2-5 | $24 | |
| 5-7 | $30 | |
| 11-13 | $30 | |
| 1-4-6-10-12-13 | 6-10 | $5 |
| 4-6 | $8 | |
| 1-4 | $10 | |
| 10-12 | $14 | |
| 12-13 | $26 |
Activity 7-11 will be crashed first by 1 week since it has the lowest crashing cost ($20). Path 1-2-5-7-11-13 will decrease by 1 week.
Activity 6-10 will be crashed first by 1 week since it has the lowest crashing cost ($5). Path 1-4-6-10-12-13 will decrease by 1 week.
The combined crash cost ($25) is ≤ $40.
Step 4:
The paths and new expected duration are:
| Path | Expected Duration |
| 1-2-5-7-11-13 | 32 |
| 1-3-8-11-13 | 32 |
| 1-3-9-12-13 | 20 |
| 1-4-6-10-12-13 | 32 |
Critical path is 1-2-5-7-11-13, 1-3-8-11-13, and 1-4-6-10-12-13.
The activities are ranked according to the cost per week to crash.
| Path | Activity | Cost ($) |
| 1-2-5-7-11-13 | 1-2 | $22 |
| 2-5 | $24 | |
| 5-7 | $30 | |
| 11-13 | $30 | |
| 1-3-8-11-13 | 1-3 | $12 |
| 11-13 | $30 | |
| 8-11 | $40 | |
| 1-4-6-10-12-13 | 4-6 | $8 |
| 1-4 | $10 | |
| 6-10 | $12 | |
| 10-12 | $14 | |
| 12-13 | $26 |
Activity 11-13 will be crashed first by 1 week since it has the lowest crashing cost ($30). Paths 1-2-5-7-11-13 and 1-3-8-11-13 will decrease by 1 week.
Activity 4-6 will be crashed first by 1 week since it has the lowest crashing cost ($8). Path 1-4-6-10-12-13 will decrease by 1 week.
The combined crash cost ($38) is ≤ $40.
Step 5:
The paths and new expected duration are:
| Path | Expected Duration |
| 1-2-5-7-11-13 | 31 |
| 1-3-8-11-13 | 31 |
| 1-3-9-12-13 | 20 |
| 1-4-6-10-12-13 | 31 |
Critical path is 1-2-5-7-11-13, 1-3-8-11-13, and 1-4-6-10-12-13.
The activities are ranked according to the cost per week to crash.
| Path | Activity | Cost ($) |
| 1-2-5-7-11-13 | 1-2 | $22 |
| 2-5 | $24 | |
| 5-7 | $30 | |
| 11-13 | $33 | |
| 1-3-8-11-13 | 1-3 | $12 |
| 11-13 | $33 | |
| 8-11 | $40 | |
| 1-4-6-10-12-13 | 1-4 | $10 |
| 6-10 | $12 | |
| 4-6 | $13 | |
| 10-12 | $14 | |
| 12-13 | $26 |
Activity 11-13 could be crashed first by 1 week since it has the lowest crashing cost ($33). Paths 1-2-5-7-11-13 and 1-3-8-11-13 will decrease by 1 week.
Activity 1-4 could be crashed first by 1 week since it has the lowest crashing cost ($10). Path 1-4-6-10-12-13 will decrease by 1 week.
The combined crash cost ($43) is ≥ $40.
Since the marginal cost of crashing is greater than the marginal benefit of crashing, crashing will be stopped at step 4.
The final project duration time is 31 weeks. The activities that are crashed are:
Activity 7-11 (First week)
Activity 7-11 (Second week)
Activity 1-2
Activity 6-10
Activity 11-13
Activity 4-6
Calculation of total crashing cost:
The total crashing cost is calculated by summing the crashing cost involved all the steps and the indirect costs every week.
The activities to be crashed are: 7-11, 1-2, 6-10, 11-13, and 4-6. The total crashing cost is $1,336,000.
b)
To Plot: The cost curve with the least expensive crashing which will reduce the project by 6 weeks.
Introduction:
Project crashing:
It is method to shorten the total time taken for a project by reducing the time taken for one or more activities on the critical path. The reduction in the normal time taken is known as crashing.
Answer to Problem 15P
Cost curve:
Explanation of Solution
Given information:
- Indirect cost is $40,000 per week.

| Activity | Crash cost first week ($000) | Crash cost second week ($000) | Crash cost third week ($000) |
| 1 to 2 | 18 | 22 | |
| 2 to 5 | 24 | 25 | 25 |
| 5 to 7 | 30 | 30 | 35 |
| 7 to 11 | 15 | 20 | |
| 11 to 13 | 30 | 33 | 36 |
| 1 to 3 | 12 | 24 | 26 |
| 3 to 8 | |||
| 8 to 11 | 40 | 40 | 40 |
| 3 to 9 | 3 | 10 | 12 |
| 9 to 12 | 2 | 7 | 10 |
| 12 to 13 | 26 | ||
| 1 to 4 | 10 | 15 | 25 |
| 4 to 6 | 8 | 13 | |
| 6 to 10 | 5 | 12 | |
| 10 to 12 | 14 | 15 |
Project crashing:
Calculation of expected duration of each path:
Path 1-2-5-7-11-13:
Path 1-3-8-11-13:
Path 1-3-9-12-13:
Path 1-4-6-10-12-13:
Step 1:
Critical path is 1-2-5-7-11-13.
The activities are ranked according to the cost per week to crash.
| Activity | Cost ($) |
| 7-11 | 15 |
| 1-2 | 18 |
| 2-5 | 24 |
| 5-7 | 30 |
| 11-13 | 30 |
Activity 7-11 will be crashed first by 1 week since it has the lowest crashing cost ($15) and this cost is ≤ 40. Path 1-2-5-7-11-13 will decrease by 1 week.
Step 2:
The paths and new expected duration are:
| Path | Expected Duration |
| 1-2-5-7-11-13 | 34 |
| 1-3-8-11-13 | 32 |
| 1-3-9-12-13 | 20 |
| 1-4-6-10-12-13 | 33 |
Critical path is 1-2-5-7-11-13.
The activities are ranked according to the cost per week to crash.
| Activity | Cost ($) |
| 1-2 | $18 |
| 7-11 | $20 |
| 2-5 | $24 |
| 5-7 | $30 |
| 11-13 | $30 |
Activity 1-2 will be crashed first by 1 week since it has the lowest crashing cost ($18) and this cost is ≤ 40. Path 1-2-5-7-11-13 will decrease by 1 week.
Step 3:
The paths and new expected duration are:
| Path | Expected Duration |
| 1-2-5-7-11-13 | 33 |
| 1-3-8-11-13 | 32 |
| 1-3-9-12-13 | 20 |
| 1-4-6-10-12-13 | 33 |
Critical path is 1-2-5-7-11-13 and 1-4-6-10-12-13.
The activities are ranked according to the cost per week to crash.
| Path | Activity | Cost ($) |
| 1-2-5-7-11-13 | 7-11 | $20 |
| 1-2 | $22 | |
| 2-5 | $24 | |
| 5-7 | $30 | |
| 11-13 | $30 | |
| 1-4-6-10-12-13 | 6-10 | $5 |
| 4-6 | $8 | |
| 1-4 | $10 | |
| 10-12 | $14 | |
| 12-13 | $26 |
Activity 7-11 will be crashed first by 1 week since it has the lowest crashing cost ($20). Path 1-2-5-7-11-13 will decrease by 1 week.
Activity 6-10 will be crashed first by 1 week since it has the lowest crashing cost ($5). Path 1-4-6-10-12-13 will decrease by 1 week.
The combined crash cost ($25) is ≤ $40.
Step 4:
The paths and new expected duration are:
| Path | Expected Duration |
| 1-2-5-7-11-13 | 32 |
| 1-3-8-11-13 | 32 |
| 1-3-9-12-13 | 20 |
| 1-4-6-10-12-13 | 32 |
Critical path is 1-2-5-7-11-13, 1-3-8-11-13, and 1-4-6-10-12-13.
The activities are ranked according to the cost per week to crash.
| Path | Activity | Cost ($) |
| 1-2-5-7-11-13 | 1-2 | $22 |
| 2-5 | $24 | |
| 5-7 | $30 | |
| 11-13 | $30 | |
| 1-3-8-11-13 | 1-3 | $12 |
| 11-13 | $30 | |
| 8-11 | $40 | |
| 1-4-6-10-12-13 | 4-6 | $8 |
| 1-4 | $10 | |
| 6-10 | $12 | |
| 10-12 | $14 | |
| 12-13 | $26 |
Activity 11-13 will be crashed first by 1 week since it has the lowest crashing cost ($30). Paths 1-2-5-7-11-13 and 1-3-8-11-13 will decrease by 1 week.
Activity 4-6 will be crashed first by 1 week since it has the lowest crashing cost ($8). Path 1-4-6-10-12-13 will decrease by 1 week.
The combined crash cost ($38) is ≤ $40.
Step 5:
The paths and new expected duration are:
| Path | Expected Duration |
| 1-2-5-7-11-13 | 31 |
| 1-3-8-11-13 | 31 |
| 1-3-9-12-13 | 20 |
| 1-4-6-10-12-13 | 31 |
Critical path is 1-2-5-7-11-13, 1-3-8-11-13, and 1-4-6-10-12-13.
The activities are ranked according to the cost per week to crash.
| Path | Activity | Cost ($) |
| 1-2-5-7-11-13 | 1-2 | $22 |
| 2-5 | $24 | |
| 5-7 | $30 | |
| 11-13 | $33 | |
| 1-3-8-11-13 | 1-3 | $12 |
| 11-13 | $33 | |
| 8-11 | $40 | |
| 1-4-6-10-12-13 | 1-4 | $10 |
| 6-10 | $12 | |
| 4-6 | $13 | |
| 10-12 | $14 | |
| 12-13 | $26 |
Activity 11-13 will be crashed first by 1 week since it has the lowest crashing cost ($33). Paths 1-2-5-7-11-13 and 1-3-8-11-13 will decrease by 1 week.
Activity 1-4 will be crashed first by 1 week since it has the lowest crashing cost ($10). Path 1-4-6-10-12-13 will decrease by 1 week. The combined crash cost is ($43).
Step 6:
The paths and new expected duration are:
| Path | Expected Duration |
| 1-2-5-7-11-13 | 30 |
| 1-3-8-11-13 | 30 |
| 1-3-9-12-13 | 20 |
| 1-4-6-10-12-13 | 30 |
Critical path is 1-2-5-7-11-13, 1-3-8-11-13, and 1-4-6-10-12-13.
The activities are ranked according to the cost per week to crash.
| Path | Activity | Cost ($) |
| 1-2-5-7-11-13 | 1-2 | $22 |
| 2-5 | $24 | |
| 5-7 | $30 | |
| 11-13 | $36 | |
| 1-3-8-11-13 | 1-3 | $12 |
| 11-13 | $36 | |
| 8-11 | $40 | |
| 1-4-6-10-12-13 | 6-10 | $12 |
| 4-6 | $13 | |
| 10-12 | $14 | |
| 1-4 | $15 | |
| 12-13 | $26 |
Activity 1-2 will be crashed first by 1 week since it has the lowest crashing cost ($22). Path 1-2-5-7-11-13 will decrease by 1 week.
Activity 1-3 will be crashed first by 1 week since it has the lowest crashing cost ($12). Path 1-3-8-11-13 will decrease by 1 week.
Activity 6-10 will be crashed first by 1 week since it has the lowest crashing cost ($12). Path 1-4-6-10-12-13 will decrease by 1 week. The combined crash cost is ($436.
The final project duration time is 29 weeks. The activities that are crashed are:
Activity 7-11 (First week)
Activity 7-11 (Second week)
Activity 1-2 (First week)
Activity 1-2 (Second week)
Activity 11-13 (First week)
Activity 11-13 (Second week)
Activity 4-6
Activity 6-10
Activity 1-4
Activity 1-3
Calculation of total crashing cost:
The total crashing cost is calculated by summing the crashing cost involved all the steps and the indirect costs every week.
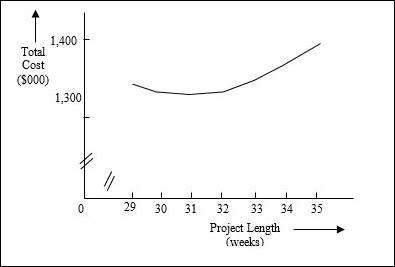
Summarization of total costs for different project lengths:
| Project Length | Cumulative Weeks shortened | Cumulative crash cost ($000) | Indirect cost ($000) | Total cost ($000) |
| A | B | C |
|
E = C+D |
| 35 | 0 | $ - | $ 1,400.00 | $ 1,400.00 |
| 34 | 1 | $ 15.00 | $ 1,360.00 | $ 1,375.00 |
| 33 | 2 | $ 33.00 | $ 1,320.00 | $ 1,353.00 |
| 32 | 3 | $ 58.00 | $ 1,280.00 | $ 1,338.00 |
| 31 | 4 | $ 96.00 | $ 1,240.00 | $ 1,336.00 |
| 30 | 5 | $ 139.00 | $ 1,200.00 | $ 1,339.00 |
| 29 | 6 | $ 185.00 | $ 1,160.00 | $ 1,345.00 |
Cost curve:
The cost curve is plotted by taking the project length on the X-axis and the total cost on the Y-axis.
Want to see more full solutions like this?
Chapter 17 Solutions
EBK OPERATIONS MANAGEMENT


- Four-drive theory recommends that companies must keep fulfillment of the four drives in balance. What is this “balance” and why is it important? Can you Give an example (real or hypothetical) of how a company maintains balanced drive fulfillment. Also describe a company that does not provide this balance, including the consequences of this imbalance on employees’ attitudes and behavior. Thank youarrow_forwardwhat criteria would you utilize to determine if someone's pay is “fair” or “egregious?” Additionally, what should be the mechanism or process to determine how much greater an organizational executive should be paid versus line-level employees?arrow_forwardDefine the concept of a compensation philosophy, including the components that should be addressed in a compensation philosophy. Assess why a compensation philosophy is so foreign to most organizations and how you can best encourage an organization to create its own compensation philosophy that is beneficial to attracting the best talent.arrow_forward
- 1) View the videos Taco Bell test-drives Live Mas restaurant concept in South Bay (0.32 mins, Ctrl+Click on the link) https://www.youtube.com/watch?v=04wRc5Wg8GU , and First-ever Taco Bell Live Mas Café serving exclusive drinks in Chula Vista (1.56 mins, Ctrl+Click on the link) https://www.youtube.com/watch?v=fq6jDxJk1LM , and answer the following questions: a) What is driving Taco Bell to try a beverage-focused format? b) What type of a process strategy does their beverage-focused format represent? c) What operational issues do you think Taco Bell would face from their beverage-focused format? d) What do you think are the main advantages and disadvantages of kiosk ordering? Note: As a rough guideline, please try to keep the written submission to one or two paragraphs for each of the questions. 2) Taipei Pharmaceuticals is planning to open a new manufacturing facility as part of its expansion plans. The firm has narrowed down the search to locate its new manufacturing facility…arrow_forward1) View the videos Taco Bell test-drives Live Mas restaurant concept in South Bay (0.32 mins, Ctrl+Click on the link) https://www.youtube.com/watch?v=04wRc5Wg8GU , and First-ever Taco Bell Live Mas Café serving exclusive drinks in Chula Vista (1.56 mins, Ctrl+Click on the link) https://www.youtube.com/watch?v=fq6jDxJk1LM , and answer the following questions: a) What is driving Taco Bell to try a beverage-focused format? b) What type of a process strategy does their beverage-focused format represent? c) What operational issues do you think Taco Bell would face from their beverage-focused format? d) What do you think are the main advantages and disadvantages of kiosk ordering? Note: As a rough guideline, please try to keep the written submission to one or two paragraphs for each of the questions. 2) Taipei Pharmaceuticals is planning to open a new manufacturing facility as part of its expansion plans. The firm has narrowed down the search to locate its new manufacturing facility…arrow_forwardThe Clothing Shack is an online retailer of men's, women's, and children's clothing. The company has been in business for four years and makes a modest profit from its online sales. However, in an effort to compete successfully against online retailing heavyweights, the Clothing Shack's marketing director, Makaya O'Neil, has determined that the Clothing Shack's marketing information systems need improvement. Ms. O'Neil feels that the Clothing Shack should begin sending out catalogs to its customers, keep better track of its customer's buying habits, perform target marketing, and provide a more personalized shopping experience for its customers. Several months ago, Ms. O'Neil submitted a systems service request (SSR) to the Clothing Shack's steering committee. The committee unanimously approved this project. You were assigned to the project at that time and have since helped your project team successfully complete the project initiation and planning phase. Your team is now ready to move…arrow_forward
- b-1. Activity ES EF LS LF Slack 1 2 3 4 5 6 7 8 9 b-2. Identify the critical activities, and determine the duration of the project. The critical activities are .arrow_forwardThe forecast for each week of a four-week schedule is 50 units. The MPS rule is to schedule production if the projected on-hand Inventory would be negative without it. Customer orders (committed) are follows: Week Customer Order 1 52 35 20 12 Use a production lot size of 75 units and no beginning Inventory. Determine the available-to-promise (ATP) quantities for each period. Note: Leave no cells blank - be certain to enter "0" wherever required. Period ATP 1 2 3arrow_forwardPrepare a master schedule given this information: The forecast for each week of an eight-week schedule is 60 units. The MPS rule is to schedule production if the projected on-hand Inventory would be negative without it. Customer orders (committed) are as follows: Week Customer Orders 1 2 36 28 4 1 Use a production lot size of 85 units and no beginning inventory. Note: In the ATP row, enter a value of 0 (zero) in any periods where ATP should not be calculated. Leave no cells blank - be certain to enter "0" wherever required. June July 1 2 3 4 5 8 7 8 Forecast 60 60 60 60 60 60 60 60 Customer Orders 38 28 4 1 0 0 0 0 Projected On-Hand Inventory MPS ATParrow_forward
- Sales of tablet computers at Marika Gonzalez's electronics store in Washington, D.C., over the past 10 weeks are shown in the table below: Week 1 2 3 4 5 6 7 8 9 10 Demand 21 21 27 38 25 30 35 24 25 30 a) The forecast for weeks 2 through 10 using exponential smoothing with a = 0.50 and a week 1 initial forecast of 21.0 are (round your responses to two decimal places): Week 1 2 3 4 5 6 7 8 9 10 Demand 21 21 27 38 25 30 35 24 25 30 Forecast 21.0 21 21 24 31 28 29 32 28 26.50 b) For the forecast developed using exponential smoothing (a = 0.50 and initial forecast 21.0), the MAD = |||||sales (round your response to two decimal places).arrow_forwardSales of tablet computers at Marika Gonzalez's electronics store in Washington, D.C., over the past 10 weeks are shown in the table below: Week Demand 1 2 3 4 5 6 7 8 9 10 21 21 27 38 25 30 35 24 25 30 a) The forecast for weeks 2 through 10 using exponential smoothing with a = 0.50 and a week 1 initial forecast of 21.0 are (round your responses to two decimal places): Week 1 2 3 4 5 Demand 21 21 27 38 Forecast 21.0 ☐ G ☐ ☐ 6 7 25 30 35 ∞ ☐ 8 9 10 24 25 30arrow_forwardEach machine costs $3 Million. Building the room with all its attendant safety protection and other ancillary costs increases the spending by an additional $2.0 million dollars per MRI suite. Each machine can perform 2000 scans per year. Each reading of an MRI scan by a radiologist, along with other per-scan-related costs, is $500 per scan. The machine will last five years. Don’t worry about discount rates for this problem Graph the total costs over 5 years as a function of sales for 0-3000 patients annually. Hint: you may need to add a second MRI at some point. Suppose that you want to make a profit of $500 per scan at a target volume of 1000 patients per year, and you purchase only one machine. Superimpose the total revenue curve on top of the total cost curve in (1).arrow_forward
 Practical Management ScienceOperations ManagementISBN:9781337406659Author:WINSTON, Wayne L.Publisher:Cengage,