Concept explainers
Three recent college graduates have formed a
a. Draw the precedence diagram.
b. What is the probability that the project can be completed in 24 days or less? In 21 days or less?
c. Suppose it is now the end of the seventh day and that activities A and B have been completed while activity D is 50 percent completed. Time estimates for the completion of activity D are 5, 6, and 7. Activities C and H are ready to begin. Determine the probability of finishing the project by day 24 and the probability of finishing by day 21.

d. The partners have decided that shortening the project by two days would be beneficial, as long as it doesn’t cost more than about $20,000. They have estimated the daily crashing costs for each activity in thousands, as shown in the following table. Which activities should be crashed, and what further analysis would they probably want to do?

a)
To draw: A precedence diagram.
Answer to Problem 7P
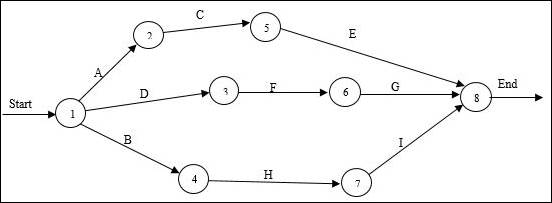
Precedence diagram:

Explanation of Solution
Given information:
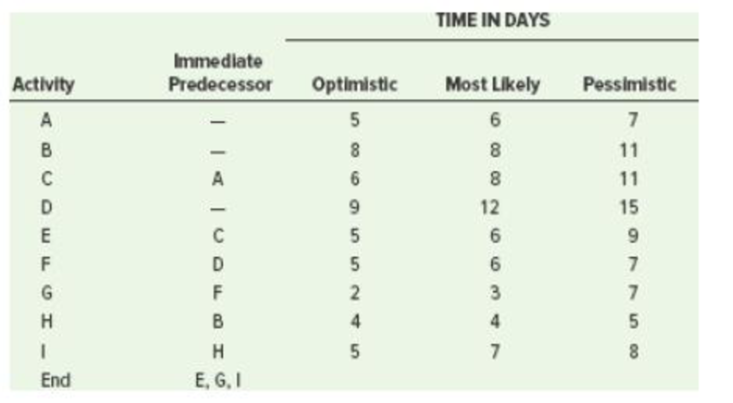
| Activity | Immediate Predecessor | Optimistic time | Most likely time | Pessimistic time |
| A | 5 | 6 | 7 | |
| B | 8 | 8 | 11 | |
| C | A | 6 | 8 | 11 |
| D | 9 | 12 | 15 | |
| E | C | 5 | 6 | 9 |
| F | D | 5 | 6 | 7 |
| G | F | 2 | 3 | 7 |
| H | B | 4 | 4 | 5 |
| I | H | 5 | 7 | 8 |
| End | E, G, I |
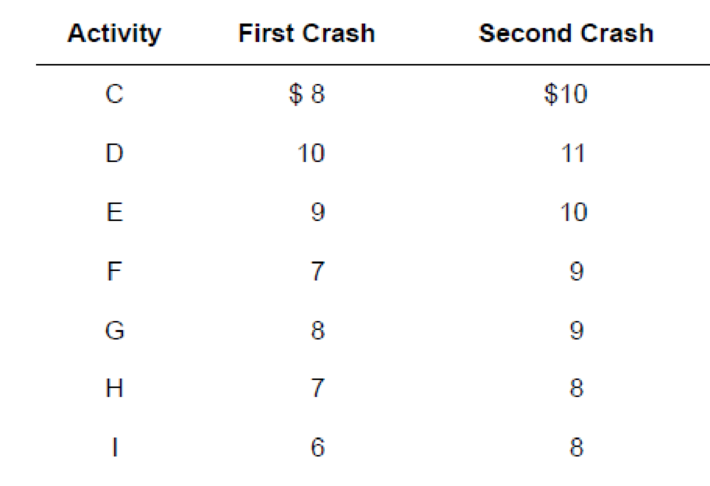
| Activity | First crash | Second crash |
| C | $ 8.00 | $ 10.00 |
| D | $ 10.00 | $ 11.00 |
| E | $ 9.00 | $ 10.00 |
| F | $ 7.00 | $ 9.00 |
| G | $ 8.00 | $ 9.00 |
| H | $ 7.00 | $ 8.00 |
| I | $ 6.00 | $ 8.00 |
Precedence diagram:

The precedence diagram is drawn from the first task till the last task. The activities are placed from left to right. The directions are represented with arrows to indicate the relationship between activities. The arrows are represented with the activity name.
b)
To determine: The probability at which the projected can be completed in 24 days or less and 21 days or less.
Answer to Problem 7P
24 days or less = 0.9686
21 days or less = 0.2350
Explanation of Solution
Given information:
| Activity | Immediate Predecessor | Optimistic time | Most likely time | Pessimistic time |
| A | 5 | 6 | 7 | |
| B | 8 | 8 | 11 | |
| C | A | 6 | 8 | 11 |
| D | 9 | 12 | 15 | |
| E | C | 5 | 6 | 9 |
| F | D | 5 | 6 | 7 |
| G | F | 2 | 3 | 7 |
| H | B | 4 | 4 | 5 |
| I | H | 5 | 7 | 8 |
| End | E, G, I |
| Activity | First crash | Second crash |
| C | $ 8.00 | $ 10.00 |
| D | $ 10.00 | $ 11.00 |
| E | $ 9.00 | $ 10.00 |
| F | $ 7.00 | $ 9.00 |
| G | $ 8.00 | $ 9.00 |
| H | $ 7.00 | $ 8.00 |
| I | $ 6.00 | $ 8.00 |
Formula to calculate expected time and variance:
Calculation of expected time and variance:
| Activity | Optimistic time | Most likely time | Pessimistic time | Expected time | Standard deviation | Variance |
| A | B | C | (A+(4*B)+C)/6 | (C-A)/6 | (C-A)^2/6^2 | |
| A | 5 | 6 | 7 | 6 | 0.333 | 0.111 |
| B | 8 | 8 | 11 | 8.5 | 0.500 | 0.250 |
| C | 6 | 8 | 11 | 8.17 | 0.833 | 0.694 |
| D | 9 | 12 | 15 | 12 | 1.000 | 1.000 |
| E | 5 | 6 | 9 | 6.33 | 0.667 | 0.444 |
| F | 5 | 6 | 7 | 6 | 0.333 | 0.111 |
| G | 2 | 3 | 7 | 3.5 | 0.833 | 0.694 |
| H | 4 | 4 | 5 | 4.17 | 0.167 | 0.028 |
| I | 5 | 7 | 8 | 6.83 | 0.500 | 0.250 |
Calculation of expected duration, variance and standard deviation for each path:
A-C-E:
D-F-G:
B-H-I:
Calculation of z value for all paths:
Formula:
24 days or less:
A-C-E:
Since z value is greater than +3.00, probability of completion is 1.00.
D-F-G:
From the standard normal distribution table,
The probability value for (z = 1.86) is 0.9686.
B-H-I:
Since z value is greater than +3.00, probability of completion is 1.00.
Probability of completion in 24 days or less:
The probability at which the project can be completed in 24 days or less is 0.9686.
21 days or less:
A-C-E:
From the standard normal distribution table,
The probability value for (z = 0.45) is 0.6736.
D-F-G:
From the standard normal distribution table,
The probability value for (z = -0.37) is 0.3557.
B-H-I:
From the standard normal distribution table,
The probability value for (z = 2.07) is 0.9808.
Probability of completion in 21 days or less:
The probability at which the project can be completed in 21 days or less is 0.2350.
c)
To determine: The probability of completing the project by day 24 and day 21.
Answer to Problem 7P
Day 24 = 0.9328
Day 21 = 0.0186
Explanation of Solution
Given information:
- At the end of 7th day activities A and B are completed and D is 50% completed.
- Time estimates of activity D completion are 5, 6 and 7.
- Activities C and H are ready to begin.
| Activity | Immediate Predecessor | Optimistic time | Most likely time | Pessimistic time |
| A | 5 | 6 | 7 | |
| B | 8 | 8 | 11 | |
| C | A | 6 | 8 | 11 |
| D | 5 | 6 | 7 | |
| E | C | 5 | 6 | 9 |
| F | D | 5 | 6 | 7 |
| G | F | 2 | 3 | 7 |
| H | B | 4 | 4 | 5 |
| I | H | 5 | 7 | 8 |
| End | E, G, I |
| Activity | First crash | Second crash |
| C | $ 8.00 | $ 10.00 |
| D | $ 10.00 | $ 11.00 |
| E | $ 9.00 | $ 10.00 |
| F | $ 7.00 | $ 9.00 |
| G | $ 8.00 | $ 9.00 |
| H | $ 7.00 | $ 8.00 |
| I | $ 6.00 | $ 8.00 |
Formula to calculate expected time and variance:
Calculation of expected time and variance:
| Activity | Optimistic time | Most likely time | Pessimistic time | Expected time | Standard deviation | Variance |
| A | B | C | (A+(4*B)+C)/6 | (C-A)/6 | (C-A)^2/6^2 | |
| A | 5 | 6 | 7 | 6 | 0.333 | 0.111 |
| B | 8 | 8 | 11 | 8.5 | 0.500 | 0.250 |
| C | 6 | 8 | 11 | 8.17 | 0.833 | 0.694 |
| D | 5 | 6 | 7 | 6 | 0.333 | 0.111 |
| E | 5 | 6 | 9 | 6.33 | 0.667 | 0.444 |
| F | 5 | 6 | 7 | 6 | 0.333 | 0.111 |
| G | 2 | 3 | 7 | 3.5 | 0.833 | 0.694 |
| H | 4 | 4 | 5 | 4.17 | 0.167 | 0.028 |
| I | 5 | 7 | 8 | 6.83 | 0.500 | 0.250 |
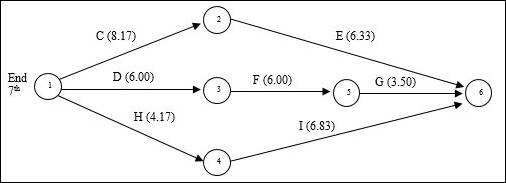
Revised project diagram:

Calculation of expected duration, variance and standard deviation for each path:
C-E:
D-F-G:
H-I:
Calculation of z value for all paths:
Formula:
24 days or less:
C-E:
From the standard normal distribution table,
The probability value for (z = 2.34) is 0.9904.
D-F-G:
From the standard normal distribution table,
The probability value for (z = 1.57) is 0.9418.
H-I:
Since z value is greater than +3.00, probability of completion is 1.00.
Probability of completion in 24 days or less:
The probability at which the project can be completed in 24 days is 0.9328.
21 days or less:
C-E:
From the standard normal distribution table,
The probability value for (z = -0.47) is 0.3192.
D-F-G:
From the standard normal distribution table,
The probability value for (z = -1.57) is 0.0582.
H-I:
Since z value is greater than +3.00, probability of completion is 1.00.
Probability of completion in 21 days or less:
The probability at which the project can be completed in 21 days is 0.0186.
d)
To determine: The activities that should be crashed and further analysis.
Explanation of Solution
Given information:
- The partners want to shorten the project by 2 days as long as the cost is not more than $20,000.
| Activity | Immediate Predecessor | Optimistic time | Most likely time | Pessimistic time |
| A | 5 | 6 | 7 | |
| B | 8 | 8 | 11 | |
| C | A | 6 | 8 | 11 |
| D | 5 | 6 | 7 | |
| E | C | 5 | 6 | 9 |
| F | D | 5 | 6 | 7 |
| G | F | 2 | 3 | 7 |
| H | B | 4 | 4 | 5 |
| I | H | 5 | 7 | 8 |
| End | E, G, I |
| Activity | First crash | Second crash |
| C | $ 8.00 | $ 10.00 |
| D | $ 10.00 | $ 11.00 |
| E | $ 9.00 | $ 10.00 |
| F | $ 7.00 | $ 9.00 |
| G | $ 8.00 | $ 9.00 |
| H | $ 7.00 | $ 8.00 |
| I | $ 6.00 | $ 8.00 |
Paths and expected duration:
| Paths | Expected Duration |
| C-E | 21.50 |
| D-F-G | 22.50 |
| H-I | 18.00 |
The critical path is D – F – G.
The activities are crashed based on the cost of crash given.
| Activity | Cost |
| F | $7 |
| G | $8 |
| D | $10 |
Step 1:
Activity F has the lowest crashing cost ($7,000) and will be crashed first for 1 day. The expected duration of D-F-G will be 21.50 days.
Step 2:
| Path | Expected Duration |
| C-E | 21.50 |
| D-F-G | 21.50 |
| H-I | 18.00 |
Now there are two critical paths C-E and D-F-G.
The critical activities are arranged in the order of low crash costs.
| Path | Activity | Cost |
| C-E | C | $8 |
| F | $9 |
| Path | Activity | Cost |
| D-F-G | D | $8 |
| F | $9 | |
| G | $10 |
One activity in each path is chosen to crash.
Activity C is crashed for 1 day since it has the lowest crashing cost ($8,000) on path C-E. The expected duration of path C-E is now 20.50 days.
Activity G is crashed for 1 day since it has the lowest crashing cost ($8,000) on path D-F-G. The expected duration of path D-F-G is now 20.50 days.
Calculation of total crashing cost:
The total cost of crashing is over the budget of $20,000 ($23,000 > $20,000). Hence, the partners will have to determine if crashing the project by 1 day or 2 days is really beneficial or not.
Want to see more full solutions like this?
Chapter 17 Solutions
EBK OPERATIONS MANAGEMENT
- Scenario You have been given a task to create a demand forecast for the second year of sales of a premium outdoor grill. Accurate forecasts are important for many reasons, including for the company to ensure they have the materials they need to create the products required in a certain period of time. Your objective is to minimize the forecast error, which will be measured using the Mean Absolute Percentage Error (MAPE) with a goal of being below 25%. You have historical monthly sales data for the past year and access to software that provides forecasts based on five different forecasting techniques (Naïve, 3-Month Moving Average, Exponential Smoothing for .2, Exponential Smooth for .5, and Seasonal) to help determine the best forecast for that particular month. Based on the given data, you will identify trends and patterns to create a more accurate forecast. Approach Consider the previous month's forecast to identify which technique is most effective. Use that to forecast the next…arrow_forwardUse the internet to obtain crash safety ratings for passenger vehicles. Then, answer thesequestions:a. Which vehicles received the highest ratings? The lowest ratings?b. How important are crash-safety ratings to new car buyers? Does the degree of importancedepend on the circumstances of the buyer?c. Which types of buyers would you expect to be the most concerned with crash-safety ratings?d. Are there other features of a new car that might sway a buyer from focusing solely on crashsafety? If so, what might they be?arrow_forward“Implementing a Performance Management Communication Plan at Accounting, Inc.” Evaluate Accounting Inc.’s communication plan. Specifically, does it answer all of the questions that a good communication plan should answer? Which questions are left unanswered? How would you provide answers to the unanswered questions? “Implementing an Appeals Process at Accounting, Inc.” If you were to design an appeals process to handle these complaints well, what would be the appeal process? Describe the recommended process and why.arrow_forward
- The annual demand for water bottles at Mega Stores is 500 units, with an ordering cost of Rs. 200 per order. If the annual inventory holding cost is estimated to be 20%. of unit cost, how frequently should he replenish his stocks? Further, suppose the supplier offers him a discount on bulk ordering as given below. Can the manager reduce his costs by taking advantage of either of these discounts? Recommend the best ordering policy for the store. Order size Unit cost (Rs.) 1 – 49 pcs. 20.00 50 – 149 pcs. 19.50 150 – 299 pcs. 19.00 300 pcs. or more 18.00arrow_forwardHelp answer showing level work and formulasarrow_forwardI need to forecast using a 3-Period-Moving-Average-Monthly forecasting model which I did but then I need to use my forecast numbers to generate a Master Production Schedule (MPS) I have to Start with actual sales (my own test data numbers) for August-2022 Oct-2022 i need to create MPS to supply demand starting November-2022 April 2023 I just added numbers without applying formulas to the mps on the right side of the spreadsheet because I do not know how to do it. The second image is the example of what it should look like. Thank You.arrow_forward
- Solve the following Question 1. How do volume and variety affect the process selection and layout types? Discuss 2. How is the human resource aspect important to operation function? Discuss 3. Discuss the supply network design and its impact on the overall performance of the organization.arrow_forwardHelp with question?arrow_forwardWhat are some good examples of bullet points on a resume for a Christian Elementary School?arrow_forward
- What is an example of a cover letter for a Christian School Long-Term Substitute Teaching position?arrow_forwardThe supply chain is a conventional notion, but organizations are only really interested in making products that they can sell to customers. Provided they have reliable supplies of materials and reasonable transport for finished products, logistics is irrelevant. Do you think this is true? If yes, explain, and if no, clearly explain as well.arrow_forwardworking as a program operations managerarrow_forward
 Practical Management ScienceOperations ManagementISBN:9781337406659Author:WINSTON, Wayne L.Publisher:Cengage,
 Operations ManagementOperations ManagementISBN:9781259667473Author:William J StevensonPublisher:McGraw-Hill Education
 Operations and Supply Chain Management (Mcgraw-hi...Operations ManagementISBN:9781259666100Author:F. Robert Jacobs, Richard B ChasePublisher:McGraw-Hill Education
 Purchasing and Supply Chain ManagementOperations ManagementISBN:9781285869681Author:Robert M. Monczka, Robert B. Handfield, Larry C. Giunipero, James L. PattersonPublisher:Cengage Learning
 Production and Operations Analysis, Seventh Editi...Operations ManagementISBN:9781478623069Author:Steven Nahmias, Tava Lennon OlsenPublisher:Waveland Press, Inc.


