
Concept explainers
Videos
To find:
The information, being represented in given graph.
Answer to Problem 9PPE
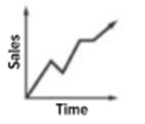
The graph represents that during a fixed time interval given, the sale of the items of an online store go in increasing, except for a very short duration. And as the sale is continuously increasing at different rate as the time of sale increases and hence the total revenue generated through the store is also simultaneously increase.
Explanation of Solution
Given information:
Given the below graph under the title, “The graph represents revenue generated through an online store.
Formula/Concept used:
Graph shows that during first interval, sales increased wit time, so revenue is increasing.
During second interval, sales decreases over a short period of time. Thus revenue decreased.
In third interval, sales increased with time, so revenue is increasing in this interval.
In fourth interval, that is shown by a straight line parallel to x axis, sales remains stable as time increases, so revenue also remains stable, in this duration.
And in fifth interval, it again goes on increasing. That means, with the time spent, the sales is also increasing proportionally.
Conclusion:
So, in above relation, it is concluded that as the store opens for more duration, its sales increases accordingly, hence generating more revenue.
Chapter 1 Solutions
EP ALGEBRA 1-ETEXT ACCESS
Additional Math Textbook Solutions
University Calculus: Early Transcendentals (4th Edition)
Elementary Statistics (13th Edition)
Pre-Algebra Student Edition
Elementary Statistics
Elementary Statistics: Picturing the World (7th Edition)


- Write an equation for the function shown. You may assume all intercepts and asymptotes are on integers. The blue dashed lines are the asymptotes. 10 9- 8- 7 6 5 4- 3- 2 4 5 15-14-13-12-11-10 -9 -8 -7 -6 -5 -4 -3 -2 1 1 2 3 -1 -2 -3 -4 1 -5 -6- -7 -8- -9 -10+ 60 7 8 9 10 11 12 13 14 15arrow_forwardUse the graph of the polynomial function of degree 5 to identify zeros and multiplicity. Order your zeros from least to greatest. -6 3 6+ 5 4 3 2 1 2 -1 -2 -3 -4 -5 3 4 6 Zero at with multiplicity Zero at with multiplicity Zero at with multiplicityarrow_forwardUse the graph to identify zeros and multiplicity. Order your zeros from least to greatest. 6 5 4 -6-5-4-3-2 3 21 2 1 2 4 5 ૪ 345 Zero at with multiplicity Zero at with multiplicity Zero at with multiplicity Zero at with multiplicity པ་arrow_forward
- Use the graph to write the formula for a polynomial function of least degree. -5 + 4 3 ♡ 2 12 1 f(x) -1 -1 f(x) 2 3. + -3 12 -5+ + xarrow_forwardUse the graph to identify zeros and multiplicity. Order your zeros from least to greatest. 6 -6-5-4-3-2-1 -1 -2 3 -4 4 5 6 a Zero at with multiplicity Zero at with multiplicity Zero at with multiplicity Zero at with multiplicityarrow_forwardUse the graph to write the formula for a polynomial function of least degree. 5 4 3 -5 -x 1 f(x) -5 -4 -1 1 2 3 4 -1 -2 -3 -4 -5 f(x) =arrow_forward
- Write the equation for the graphed function. -8 ง -6-5 + 5 4 3 2 1 -3 -2 -1 -1 -2 4 5 6 6 -8- f(x) 7 8arrow_forwardWrite the equation for the graphed function. 8+ 7 -8 ง A -6-5 + 6 5 4 3 -2 -1 2 1 -1 3 2 3 + -2 -3 -4 -5 16 -7 -8+ f(x) = ST 0 7 8arrow_forwardThe following is the graph of the function f. 48- 44 40 36 32 28 24 20 16 12 8 4 -4 -3 -1 -4 -8 -12 -16 -20 -24 -28 -32 -36 -40 -44 -48+ Estimate the intervals where f is increasing or decreasing. Increasing: Decreasing: Estimate the point at which the graph of ƒ has a local maximum or a local minimum. Local maximum: Local minimum:arrow_forward
- For the following exercise, find the domain and range of the function below using interval notation. 10+ 9 8 7 6 5 4 3 2 1 10 -9 -8 -7 -6 -5 -4 -3 -2 -1 2 34 5 6 7 8 9 10 -1 -2 Domain: Range: -4 -5 -6 -7- 67% 9 -8 -9 -10-arrow_forward1. Given that h(t) = -5t + 3 t². A tangent line H to the function h(t) passes through the point (-7, B). a. Determine the value of ẞ. b. Derive an expression to represent the gradient of the tangent line H that is passing through the point (-7. B). c. Hence, derive the straight-line equation of the tangent line H 2. The function p(q) has factors of (q − 3) (2q + 5) (q) for the interval -3≤ q≤ 4. a. Derive an expression for the function p(q). b. Determine the stationary point(s) of the function p(q) c. Classify the stationary point(s) from part b. above. d. Identify the local maximum of the function p(q). e. Identify the global minimum for the function p(q). 3. Given that m(q) = -3e-24-169 +9 (-39-7)(-In (30-755 a. State all the possible rules that should be used to differentiate the function m(q). Next to the rule that has been stated, write the expression(s) of the function m(q) for which that rule will be applied. b. Determine the derivative of m(q)arrow_forwardSafari File Edit View History Bookmarks Window Help Ο Ω OV O mA 0 mW ర Fri Apr 4 1 222 tv A F9 F10 DII 4 F6 F7 F8 7 29 8 00 W E R T Y U S D பட 9 O G H J K E F11 + 11 F12 O P } [arrow_forward
 Algebra and Trigonometry (6th Edition)AlgebraISBN:9780134463216Author:Robert F. BlitzerPublisher:PEARSON
 Contemporary Abstract AlgebraAlgebraISBN:9781305657960Author:Joseph GallianPublisher:Cengage Learning
 Linear Algebra: A Modern IntroductionAlgebraISBN:9781285463247Author:David PoolePublisher:Cengage Learning
 Algebra And Trigonometry (11th Edition)AlgebraISBN:9780135163078Author:Michael SullivanPublisher:PEARSON
 Introduction to Linear Algebra, Fifth EditionAlgebraISBN:9780980232776Author:Gilbert StrangPublisher:Wellesley-Cambridge Press
 College Algebra (Collegiate Math)AlgebraISBN:9780077836344Author:Julie Miller, Donna GerkenPublisher:McGraw-Hill Education