
Concept explainers
Videos
(a)
To describe: The accuracy of the line.
(a)
Explanation of Solution
Given:
The graph of the mass of marbles is shown in Figure 1.

Figure 1
Each point on the graph shows the relation between the number of marble and its mass where the number of marbles is the independent variable and the mass is dependent variable.
The accuracy of the line depends on the closeness of the points to the line.
It can be seen from the given graph that some points are above the line and some are below the line and some are passing through.
The points are close to the line. Therefore, there is high
The points are close to the line but all points do not pass through the line. In conclusion accuracy is quite good but not perfectly correct.
(b)
To find: The approximate mass of 7 marbles.
(b)
Answer to Problem 24PPE
The approximate mass of 7 marbles is 1.1g.
Explanation of Solution
Given:
The graph of the mass of marbles is shown in Figure 1.

Figure 1
The number of marbles is shown on the horizontal axis that is independent variable and the mass is shown on the vertical axis that is dependent variable.
See the point for 7 marbles on the graph.
It can be observed from Figure 1 that the approximate mass of 7 marbles is 1.1g.
Therefore, the approximate mass of 7 marbles is 1.1g.
(c)
To explain: The reason of few points is above the line and some are below the line.
(c)
Explanation of Solution
Given:
The graph of the mass of marbles is shown in Figure 1.
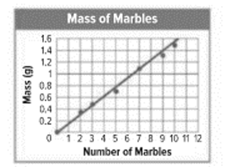
Figure 1
The set of points are the
The line of best fit is the line passes through the points or closely to the point. If half of the data points on the scatter point is below the line and half above the line.
It can be seen from Figure 1 that the data points come close to the line of the best fit that means the
The positive correlation is high since it predicts the values near the line some points are above the line and some are below the line.
(d)
To make: A conjecture for the approximate mass of 20 marbles and explain the reasoning.
(d)
Explanation of Solution
Given:
The graph of the mass of marbles is shown in Figure 1.

Figure 1
It can be observed from the Figure 1 that the possible set of points are represented in the below table.
| Number of marbles | Mass |
| 0 | 0 |
| 2 | 0.38 |
| 3 | 0.5 |
| 5 | 0.7 |
| 7 | 1.1 |
| 9 | 1.3 |
| 10 | 1.48 |
It can be seen that that the line of the regression is the form of
The point is 1.48 at the time of 10 marbles.
Therefore, there is possibility of the slope is 1.433 and the y- intercept is 0.05 something.
Substitute 1.433 for
Take these points for the line to make a conjecture for the 20 marbles.
Substitute 20 for
Therefore, it would be 2.433 something.
Chapter 1 Solutions
EP ALGEBRA 1-ETEXT ACCESS
Additional Math Textbook Solutions
Elementary Statistics
Algebra and Trigonometry (6th Edition)
Thinking Mathematically (6th Edition)
Calculus: Early Transcendentals (2nd Edition)
Pre-Algebra Student Edition
Elementary Statistics: Picturing the World (7th Edition)


- Write an equation for the function shown. You may assume all intercepts and asymptotes are on integers. The blue dashed lines are the asymptotes. 10 9- 8- 7 6 5 4- 3- 2 4 5 15-14-13-12-11-10 -9 -8 -7 -6 -5 -4 -3 -2 1 1 2 3 -1 -2 -3 -4 1 -5 -6- -7 -8- -9 -10+ 60 7 8 9 10 11 12 13 14 15arrow_forwardUse the graph of the polynomial function of degree 5 to identify zeros and multiplicity. Order your zeros from least to greatest. -6 3 6+ 5 4 3 2 1 2 -1 -2 -3 -4 -5 3 4 6 Zero at with multiplicity Zero at with multiplicity Zero at with multiplicityarrow_forwardUse the graph to identify zeros and multiplicity. Order your zeros from least to greatest. 6 5 4 -6-5-4-3-2 3 21 2 1 2 4 5 ૪ 345 Zero at with multiplicity Zero at with multiplicity Zero at with multiplicity Zero at with multiplicity པ་arrow_forward
- Use the graph to write the formula for a polynomial function of least degree. -5 + 4 3 ♡ 2 12 1 f(x) -1 -1 f(x) 2 3. + -3 12 -5+ + xarrow_forwardUse the graph to identify zeros and multiplicity. Order your zeros from least to greatest. 6 -6-5-4-3-2-1 -1 -2 3 -4 4 5 6 a Zero at with multiplicity Zero at with multiplicity Zero at with multiplicity Zero at with multiplicityarrow_forwardUse the graph to write the formula for a polynomial function of least degree. 5 4 3 -5 -x 1 f(x) -5 -4 -1 1 2 3 4 -1 -2 -3 -4 -5 f(x) =arrow_forward
- Write the equation for the graphed function. -8 ง -6-5 + 5 4 3 2 1 -3 -2 -1 -1 -2 4 5 6 6 -8- f(x) 7 8arrow_forwardWrite the equation for the graphed function. 8+ 7 -8 ง A -6-5 + 6 5 4 3 -2 -1 2 1 -1 3 2 3 + -2 -3 -4 -5 16 -7 -8+ f(x) = ST 0 7 8arrow_forwardThe following is the graph of the function f. 48- 44 40 36 32 28 24 20 16 12 8 4 -4 -3 -1 -4 -8 -12 -16 -20 -24 -28 -32 -36 -40 -44 -48+ Estimate the intervals where f is increasing or decreasing. Increasing: Decreasing: Estimate the point at which the graph of ƒ has a local maximum or a local minimum. Local maximum: Local minimum:arrow_forward
- For the following exercise, find the domain and range of the function below using interval notation. 10+ 9 8 7 6 5 4 3 2 1 10 -9 -8 -7 -6 -5 -4 -3 -2 -1 2 34 5 6 7 8 9 10 -1 -2 Domain: Range: -4 -5 -6 -7- 67% 9 -8 -9 -10-arrow_forward1. Given that h(t) = -5t + 3 t². A tangent line H to the function h(t) passes through the point (-7, B). a. Determine the value of ẞ. b. Derive an expression to represent the gradient of the tangent line H that is passing through the point (-7. B). c. Hence, derive the straight-line equation of the tangent line H 2. The function p(q) has factors of (q − 3) (2q + 5) (q) for the interval -3≤ q≤ 4. a. Derive an expression for the function p(q). b. Determine the stationary point(s) of the function p(q) c. Classify the stationary point(s) from part b. above. d. Identify the local maximum of the function p(q). e. Identify the global minimum for the function p(q). 3. Given that m(q) = -3e-24-169 +9 (-39-7)(-In (30-755 a. State all the possible rules that should be used to differentiate the function m(q). Next to the rule that has been stated, write the expression(s) of the function m(q) for which that rule will be applied. b. Determine the derivative of m(q)arrow_forwardSafari File Edit View History Bookmarks Window Help Ο Ω OV O mA 0 mW ర Fri Apr 4 1 222 tv A F9 F10 DII 4 F6 F7 F8 7 29 8 00 W E R T Y U S D பட 9 O G H J K E F11 + 11 F12 O P } [arrow_forward
 Algebra and Trigonometry (6th Edition)AlgebraISBN:9780134463216Author:Robert F. BlitzerPublisher:PEARSON
 Contemporary Abstract AlgebraAlgebraISBN:9781305657960Author:Joseph GallianPublisher:Cengage Learning
 Linear Algebra: A Modern IntroductionAlgebraISBN:9781285463247Author:David PoolePublisher:Cengage Learning
 Algebra And Trigonometry (11th Edition)AlgebraISBN:9780135163078Author:Michael SullivanPublisher:PEARSON
 Introduction to Linear Algebra, Fifth EditionAlgebraISBN:9780980232776Author:Gilbert StrangPublisher:Wellesley-Cambridge Press
 College Algebra (Collegiate Math)AlgebraISBN:9780077836344Author:Julie Miller, Donna GerkenPublisher:McGraw-Hill Education