A chemical plant makes three major products on a weekly basis. Each of these products requires a certain quantity of raw chemical and different production times, and yields different profits. Thepertinentin formation is in Table P16.5. Note that there is sufficient warehouse space at the plant to store a total of 450 kg/week.
TABLE P16.5
| Product 1 | Product 2 | Product 3 | Resource Availability | |
| Raw chemical |
|
|
13kg/kg |
|
| Production time |
|
|
0.2hr/kg |
|
| Product |
|
|
|
(a) Set up a linear programming problem to maximize profit.
(b) Solve the linear programming problem with the simplex method.
(c) Solve the problem with a software package.
(d) Evaluate which of the following options will raise profits the most: increasing raw chemical, production time, or storage.
(a)
A linear programming problem for a chemical plant that makes three products on a weekly basis. The data is given below:
Answer to Problem 5P
Solution:
The Linear Programming formulation is given as:
Subject to Constraints:
Explanation of Solution
Given Information:
Following data is given for a chemical plant that makes three products on a weekly basis:
Also, the warehouse can store a total of
Let
The Linear Programming Model can be set up as follows:
As Profit is to be maximized, the objective function is
The constraints are:
The raw chemical constraint is
As the total production time must be equal to or less than
The storage available is
Also, the weights can never be negative. Thus, positivity constraint is
Hence, the Linear Programming formulation is given as:
Subject to Constraints:
(b)
To calculate: The solution of the linear programming problem given below:
Subject to Constraints:
Answer to Problem 5P
Solution:
The values of variables are
Explanation of Solution
Given Information:
A linear programming problem,
Subject to Constraints:
Calculation:
Consider the provided linear programming problem,
Subject to Constraints:
First convert the above problem to standard form by adding slack variables.
As the constraints are subjected to less than condition, non- negative slack variables are added to reach equality.
Let the slack variables be
Thus, the linear programming model would be:
The above linear programming models consist of three non-basic variables
Now the apply the Simplex method and solve the above problem as:
The negative minimum, P is
The minimum ratio is 230.7692 and it corresponds to basis variable S1. So, the leaving variable is S1.
Therefore, the pivot element is 13.
The negative minimum, P is
The minimum ratio is 356.25 and it corresponds to basis variable S3. So, the leaving variable is S3.
Therefore, the pivot element is 0.61539.
Since
Hence, the values of variables are
(c)
To calculate: The solution of the linear programming problem given below using software package:
Subject to Constraints:
Answer to Problem 5P
Solution:
The values of variables are
Explanation of Solution
Given Information:
A linear programming problem,
Subject to Constraints:
Calculation:
Consider the provided linear programming problem,
Subject to Constraints:
The solution can be obtained using Excel.
Set up the values and use the formula as shown below:

The values obtained are:

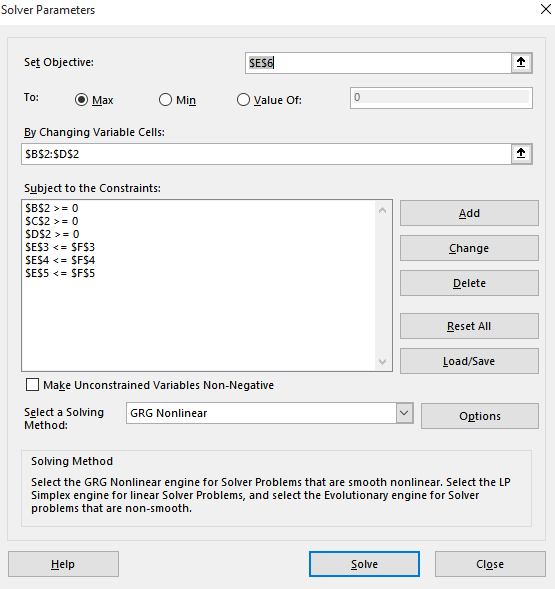
Now press Solver under Data tab and enter the constraints and objective as shown below:

The resulting solution is:

Hence, the values of variables are
(d)
The factor among increasing raw material, production time or storage that will rise profits the most for the linear programming problem given below:
Subject to Constraints:
Answer to Problem 5P
Solution:
Increasing storage will result in the most profits.
Explanation of Solution
Given Information:
A linear programming problem,
Subject to Constraints:
Calculation:
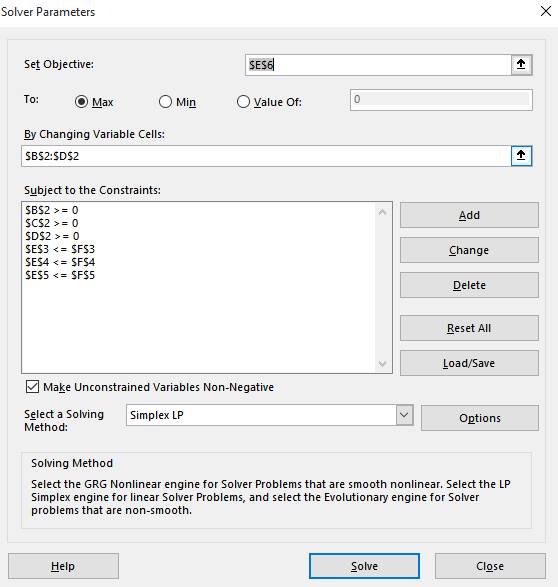
Open the Excel sheet of part (c), then Press Solver under Data and select Simplex LP as a solving method as shown below:

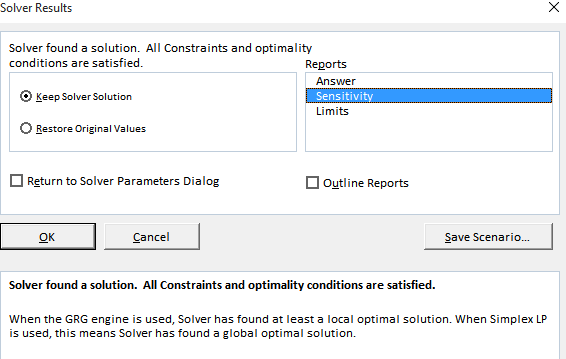
Press solve then select Sensitivity in reports as shown below:

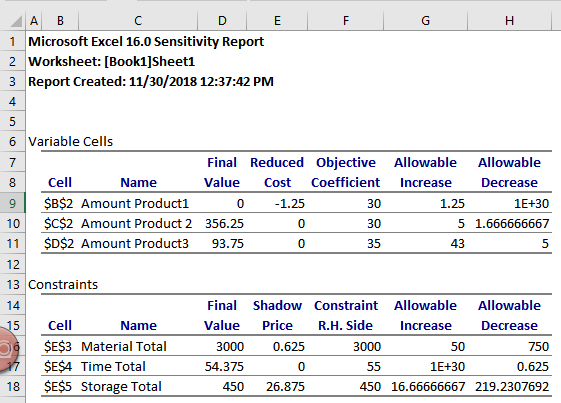
The sensitivity report obtained is:

The high shadow price for storage implies that increasing storage will result in the most profits.
Want to see more full solutions like this?
Chapter 16 Solutions
Numerical Methods for Engineers
- Theorem 1: A number n ∈ N is divisible by 3 if and only if when n is writtenin base 10 the sum of its digits is divisible by 3. As an example, 132 is divisible by 3 and 1 + 3 + 2 is divisible by 3.1. Prove Theorem 1 2. Using Theorem 1 construct an NFA over the alphabet Σ = {0, 1, 2, 3, 4, 5, 6, 7, 8, 9}which recognizes the language {w ∈ Σ^(∗)| w = 3k, k ∈ N}.arrow_forwardRecall the RSA encryption/decryption system. The following questions are based on RSA. Suppose n (=15) is the product of the two prime numbers 3 and 5.1. Find an encryption key e for for the pair (e, n)2. Find a decryption key d for for the pair (d, n)3. Given the plaintext message x = 3, find the ciphertext y = x^(e) (where x^e is the message x encoded with encryption key e)4. Given the ciphertext message y (which you found in previous part), Show that the original message x = 3 can be recovered using (d, n)arrow_forwardFind the sum of products expansion of the function F(x, y, z) = ¯x · y + x · z in two ways: (i) using a table; and (ii) using Boolean identities.arrow_forward
- Give both a machine-level description (i.e., step-by-step description in words) and a state-diagram for a Turing machine that accepts all words over the alphabet {a, b} where the number of a’s is greater than or equal to the number of b’s.arrow_forwardCompute (7^ (25)) mod 11 via the algorithm for modular exponentiation.arrow_forwardProve that the sum of the degrees in the interior angles of any convex polygon with n ≥ 3 sides is (n − 2) · 180. For the base case, you must prove that a triangle has angles summing to 180 degrees. You are permitted to use thefact when two parallel lines are cut by a transversal that corresponding angles are equal.arrow_forward
- Answer the following questions about rational and irrational numbers.1. Prove or disprove: If a and b are rational numbers then a^b is rational.2. Prove or disprove: If a and b are irrational numbers then a^b is irrational.arrow_forwardProve the following using structural induction: For any rooted binary tree T the number of vertices |T| in T satisfies the inequality |T| ≤ (2^ (height(T)+1)) − 1.arrow_forward(a) Prove that if p is a prime number and p|k^2 for some integer k then p|k.(b) Using Part (a), prove or disprove: √3 ∈ Q.arrow_forward
- Provide a context-free grammar for the language {a^ (i) b^ (j) c^ (k) | i, j, k ∈ N, i = j or i = k}. Briefly explain (no formal proof needed) why your context-free grammar is correct and show that it produces the word aaabbccc.arrow_forwardDo College Students With Part-Time Jobs Sleep Less? College students were surveyed about the number of hours they sleep each night.Group A = With part-time jobs | Group B = Without jobs Group A: 6, 5, 7, 6, 5Group B: 8, 7, 9, 8, 7 Instructions: State your hypothesis and perform a two-sample t-test with all formulas. Create histograms for each group. Label axes and add titles. Comment on the distribution shape (e.g., normal, skewed, etc.).Solve on pen and paperarrow_forwardThis is advanced mathematics question that need detailed solutionsarrow_forward

 Linear Algebra: A Modern IntroductionAlgebraISBN:9781285463247Author:David PoolePublisher:Cengage LearningAlgebra & Trigonometry with Analytic GeometryAlgebraISBN:9781133382119Author:SwokowskiPublisher:Cengage


