Videos
(a)
Interpretation:
The given organic compound has to be named.
Concept introduction:
In chemistry Structure is the arrangement of
IUPAC rules for naming
Name the longest chain that contains the double bond or double bonds. The name of the chain will end in –ene.
Number longest chain so
Name and number the substituent(s) before the name of the longest continuous chain.
Write the alkyl groups in alphabetical order regardless of their position on the chain.
(b)
Interpretation:
The given organic compound has to be named.
Concept introduction:
In chemistry Structure is the arrangement of chemical bonds between atoms in a molecule, specifically which atoms are chemically bonded to what other atoms with what kind of chemical bond.
IUPAC rules for naming alcohols
The nomenclature of alcohol like
The position of the alkyl and hydroxyl groups that attached to the carbon chains are shown by numbering the carbon atoms. The hydroxyl group must always get the smallest possible number.

(c)
Interpretation:
The given organic compound has to be named.
Concept introduction:
In chemistry Structure is the arrangement of chemical bonds between atoms in a molecule, specifically which atoms are chemically bonded to what other atoms with what kind of chemical bond.
Depending on the number of carbon side chain of the nitrogen, different types of amines can form.
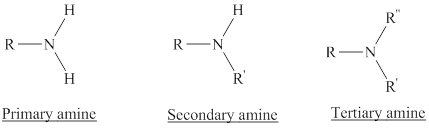
Primary amines can be named in the IUPAC system in several ways,
For simple amines the suffix – amine is added to the name of the alkyl substituent.
The suffix-amine can be used in place of the final –e in the name of the parent compound.
For a secondary amine an N prefixes the compound giving the shorter carbon chain and its chain prefix name.
For a tertiary amine an N, N prefixes the compound giving the two shorter carbon chains and their side chain prefix names.
Want to see the full answer?
Check out a sample textbook solution
Chapter 16 Solutions
Fundamentals of General, Organic, and Biological Chemistry (8th Edition)


- Sodium fluoroacetate (FCH 2CO2Na) is a very toxic molecule that is used as rodentpoison. It is converted enzymatically to fluoroacetyl-CoA and is utilized by citratesynthase to generate (2R,3S)-fluorocitrate. The release of this product is a potentinhibitor of the next enzyme in the TCA cycle. Show the mechanism for theproduction of fluorocitrate and explain how this molecule acts as a competitiveinhibitor. Predict the effect on the concentrations of TCA intermediates.arrow_forwardIndicate for the reactions below which type of enzyme and cofactor(s) (if any) wouldbe required to catalyze each reaction shown. 1) Fru-6-P + Ery-4-P <--> GAP + Sed-7-P2) Fru-6-P + Pi <--> Fru-1,6-BP + H2O3) GTP + ADP <--> GDP + ATP4) Sed-7-P + GAP <--> Rib-5-P + Xyl-5-P5) Oxaloacetate + GTP ---> PEP + GDP + CO 26) DHAP + Ery-4-P <--> Sed-1,7-BP + H 2O7) Pyruvate + ATP + HCO3- ---> Oxaloacetate + ADP + Piarrow_forwardTPP is also utilized in transketolase reactions in the PPP. Give a mechanism for theTPP-dependent reaction between Xylulose-5-phosphate and Ribose-5-Phosphate toyield Glyceraldehyde-3-phosphate and Sedoheptulose-7-Phosphate.arrow_forward
- What is the difference between a ‘synthetase’ and a ‘synthase’?arrow_forwardIn three separate experiments, pyruvate labeled with 13C at C-1, C-2, or C-3 is introduced to cells undergoing active metabolism. Trace the fate of each carbon through the TCA cycle and show when each of these carbons produces 13CO2.a. Glucose is similarly labeled at C-2 with 13C. During which reaction will this labeled carbon be released as 13CO2?arrow_forwardDraw the Krebs Cycle and show the entry points for the amino acids Alanine,Glutamic Acid, Asparagine, and Valine into the Krebs Cycle. How many rounds of Krebs will be required to waste all Carbons of Glutamic Acidas CO2?arrow_forward
- Suppose the data below are obtained for an enzyme catalyzed reaction with and without the inhibitor I. (s)( mM) 0.2 0.4 0.8 1.0 2.0 4.0 V without i (mM/min) 5.0 7.5 10.0 10.7 12.5 13.6 V with I (mM/min) 3.0 5.0 7.5 8.3 10.7 12.5 Make a Lineweaver Burke plot for this data using graph paper or a spreadsheet Calculate KM and Vmax without inhibitor. What type of inhibition is observed? show graph and work 2. Give the Lineweaver Burk equation and define all the parameters. 3. When substrate concentration is much greater than Km, the rate of catalysis is almost equal to a. kcat b. none of these c. all of these d. Kd e. Vmaxarrow_forwardPlease explain the process of how an axon degenerates in the central nervous system following injury and how it affects the neuron/cell body, as well as presynaptic and postsynaptic neurons. Explain processes such as chromatolysis and how neurotrophin signaling works.arrow_forwardPlease help determine the Relative Response Ratio of my GC-MS laboratory: Laboratory: Alcohol Content in Hand Sanditizers Internal Standard: Butanol Standards of Alcohols: Methanol, Ethanol, Isopropyl, n-Propanol, Butanol Recorded Retention Times: 0.645, 0.692, 0.737, 0.853, 0.977 Formula: [ (Aanalyte / Canalyte) / (AIS / CIS) ]arrow_forward
- Please help determine the Relative Response Ratio of my GC-MS laboratory: Laboratory: Alcohol Content in Hand Sanditizers Internal Standard: Butanol Standards of Alcohols: Methanol, Ethanol, Isopropyl, n-Propanol, Butanol Recorded Retention Times: 0.645, 0.692, 0.737, 0.853, 0.977 Formula: [ (Aanalyte / Canalyte) / (AIS / CIS) ]arrow_forwardplease draw it for me and tell me where i need to modify the structurearrow_forwardPlease help determine the standard curve for my Kinase Activity in Excel Spreadsheet. Link: https://mnscu-my.sharepoint.com/personal/vi2163ss_go_minnstate_edu/_layouts/15/Doc.aspx?sourcedoc=%7B958f5aee-aabd-45d7-9f7e-380002892ee0%7D&action=default&slrid=9b178ea1-b025-8000-6e3f-1cbfb0aaef90&originalPath=aHR0cHM6Ly9tbnNjdS1teS5zaGFyZXBvaW50LmNvbS86eDovZy9wZXJzb25hbC92aTIxNjNzc19nb19taW5uc3RhdGVfZWR1L0VlNWFqNVc5cXRkRm4zNDRBQUtKTHVBQldtcEtWSUdNVmtJMkoxQzl3dmtPVlE_cnRpbWU9eEE2X291ZHIzVWc&CID=e2126631-9922-4cc5-b5d3-54c7007a756f&_SRM=0:G:93 Determine the amount of VRK1 is present 1. Average the data and calculate the mean absorbance for each concentration/dilution (Please over look for Corrections) 2. Blank Correction à Subtract 0 ug/mL blank absorbance from all readings (Please over look for Corrections) 3. Plot the Standard Curve (Please over look for Corrections) 4. Convert VRK1 concentration from ug/mL to g/L 5. Use the molar mass of VRK1 to convert to M and uM…arrow_forward

 Principles Of Radiographic Imaging: An Art And A ...Health & NutritionISBN:9781337711067Author:Richard R. Carlton, Arlene M. Adler, Vesna BalacPublisher:Cengage Learning