
(a)
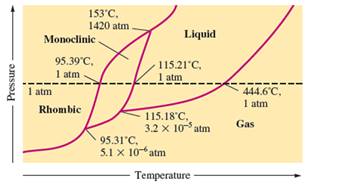
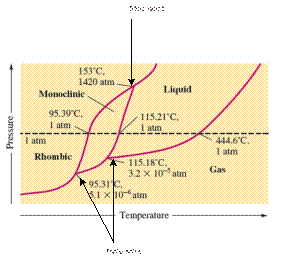
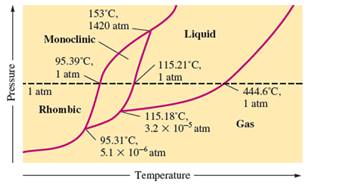
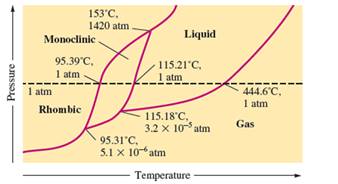
Interpretation: The number of triple points in the given phase diagram of sulfur needs to be determined.
Concept Introduction:
The conversion of
The heating -cooling curve is the curve of temperature v/s time that interpret the change in the states of matter with increase in temperature.
The phase diagram represents the change in the physical state of given substance with temperature and pressure.
(a)
Answer to Problem 104E
There are three triple points in the given phase diagram of sulfur.
Explanation of Solution
A triple point is the point in the phase diagram at which all the three phases will join together. It indicates the point (temperature and pressure) at which all three states remain in equilibrium.
(b)
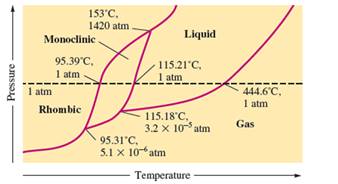
Interpretation: The phases at the triple points in the given phase diagram of sulfur needs to be determined.
Concept Introduction:
The conversion of solid to liquid and gas involves the change in temperature that can display in heat curve.
The heating -cooling curve is the curve of temperature v/s time that interpret the change in the states of matter with increase in temperature.
The phase diagram represents the change in the physical state of given substance with temperature and pressure.
(b)
Answer to Problem 104E
- At 95.31°C: rhombic, monoclinic, gas
- At 115.18°C: monoclinic, liquid, gas
- At 153°C: rhombic, monoclinic, and liquid
Explanation of Solution
A triple point is the point in the phase diagram at which all the three phases will join together. It indicates the point (temperature and pressure) at which all three states remain in equilibrium.
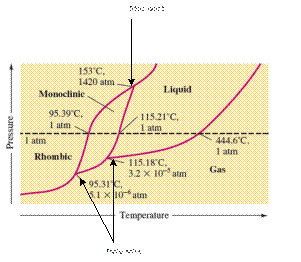
At 95.31°C, the rhombic, monoclinic and gaseous state of sulfur are in equilibrium whereas at 115.18°C monoclinic, liquid and gaseous state of sulfur. The 3rd triple point is at 153°C at which rhombic, monoclinic, and liquid state of sulfur.
(c)
Interpretation: The phases which are stable at room temperature and 1.0 atm pressure in the given phase diagram of sulfur needs to be determined.
Concept Introduction:
The conversion of solid to liquid and gas involves the change in temperature that can display in heat curve.
The heating -cooling curve is the curve of temperature v/s time that interpret the change in the states of matter with increase in temperature.
The phase diagram represents the change in the physical state of given substance with temperature and pressure.
(c)
Answer to Problem 104E
At room temperature and 1.0 atm pressure,the rhombic phase of sulfur is stable. The temperature is approximately ˜ 20°C and pressure is 1.0 atm.
Explanation of Solution
In the given phase diagram, there are four states of sulfur; monoclinic, rhombic, liquid and gaseous state of sulfur.
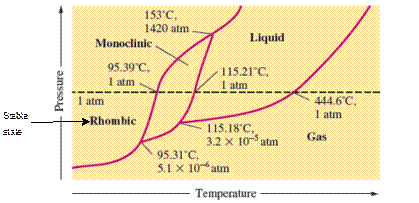
At room temperature and 1.0 atm pressure, the rhombic phase of sulfur is stable. The temperature is approximately ˜ 20°C and pressure is 1.0 atm.
(d)
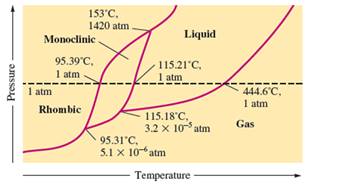
Interpretation: The possibility of existence of monoclinic sulfur in equilibrium with sulfur vapor needs to be determined.
Concept Introduction:
The conversion of solid to liquid and gas involves the change in temperature that can display in heat curve.
The heating -cooling curve is the curve of temperature v/s time that interpret the change in the states of matter with increase in temperature.
The phase diagram represents the change in the physical state of given substance with temperature and pressure.
(d)
Answer to Problem 104E
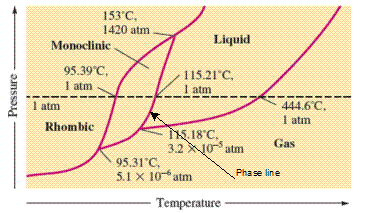
The monoclinic sulfur and vapor or gaseous state of matter share the phase line therefore they can be in equilibrium in the phase diagram.
Explanation of Solution
In the given phase diagram, there are four states of sulfur; monoclinic, rhombic, liquid and gaseous state of sulfur. The monoclinic sulfur and vapor or gaseous state of matter share the phase line therefore they can be in equilibrium in the phase diagram.
(e)
Interpretation: The normal boiling point and normal melting point of sulfur according to given phase diagram needs to be determined.
Concept Introduction:
The conversion of solid to liquid and gas involves the change in temperature that can display in heat curve.
The heating -cooling curve is the curve of temperature v/s time that interpret the change in the states of matter with increase in temperature.
The phase diagram represents the change in the physical state of given substance with temperature and pressure.
(e)
Answer to Problem 104E
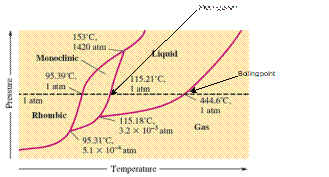
Normal melting point = 115.21°C
Normal boiling point = 444.6°C
Explanation of Solution
In the given phase diagram, there are four states of sulfur; monoclinic, rhombic, liquid and gaseous state of sulfur. Boiling point is the temperature at which liquid and gaseous state remain in equilibrium at 1 atm pressure. According to given phase diagram, the normal boiling point of sulfur must be 444.6°C. The melting point of substance is the temperature at which solid melts to liquid state which is 115.21 °C for sulfur.
(f)
Interpretation: The denser phase out of solid, monoclinic or rhombic sulfur according to given phase diagram needs to be determined.
Concept Introduction:
The conversion of solid to liquid and gas involves the change in temperature that can display in heat curve.
The heating -cooling curve is the curve of temperature v/s time that interpret the change in the states of matter with increase in temperature.
The phase diagram represents the change in the physical state of given substance with temperature and pressure.
(f)
Answer to Problem 104E
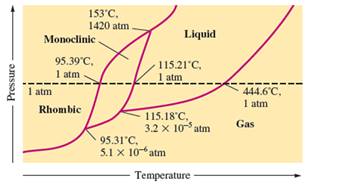
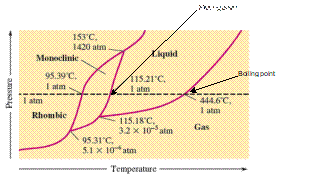
Rhombic sulfur is the densest phase of sulfur.
Explanation of Solution
In the given phase diagram, there are four states of sulfur; monoclinic, rhombic, liquid and gaseous state of sulfur. The Rhombic phase of sulfur is most dense phase of it compare to monoclinic and solid. This is because the rhombic-monoclinic equilibrium line has a positive slope therefore with increase in the temperature, the rhombic phase changes to monoclinic.
Want to see more full solutions like this?
Chapter 16 Solutions
EBK WEBASSIGN FOR ZUMDAHL'S CHEMICAL PR
- For each reaction below, decide if the first stable organic product that forms in solution will create a new CC bond, and check the appropriate box. Next, for each reaction to which you answered "Yes" to in the table, draw this product in the drawing area below. Note for advanced students: for this problem, don't worry if you think this product will continue to react under the current conditions - just focus on the first stable product you expect to form in solution. དྲ。 ✗MgBr ? O CI Will the first product that forms in this reaction create a new C-C bond? Yes No • ? Will the first product that forms in this reaction create a new CC bond? Yes No × : ☐ Xarrow_forwardPredict the major products of this organic reaction: OH NaBH4 H ? CH3OH Note: be sure you use dash and wedge bonds when necessary, for example to distinguish between major products with different stereochemistry. Click and drag to start drawing a structure. ☐ : Sarrow_forwardPredict the major products of this organic reaction: 1. LIAIHA 2. H₂O ? Note: be sure you use dash and wedge bonds when necessary, for example to distinguish between major products with different stereochemistry. Click and drag to start drawing a structure. X : ☐arrow_forward
- For each reaction below, decide if the first stable organic product that forms in solution will create a new C - C bond, and check the appropriate box. Next, for each reaction to which you answered "Yes" to in the table, draw this product in the drawing area below. Note for advanced students: for this problem, don't worry if you think this product will continue to react under the current conditions - just focus on the first stable product you expect to form in solution. NH2 tu ? ? OH Will the first product that forms in this reaction create a new CC bond? Yes No Will the first product that forms in this reaction create a new CC bond? Yes No C $ ©arrow_forwardAs the lead product manager at OrganometALEKS Industries, you are trying to decide if the following reaction will make a molecule with a new C-C bond as its major product: 1. MgCl ? 2. H₂O* If this reaction will work, draw the major organic product or products you would expect in the drawing area below. If there's more than one major product, you can draw them in any arrangement you like. Be sure you use wedge and dash bonds if necessary, for example to distinguish between major products with different stereochemistry. If the major products of this reaction won't have a new CC bond, just check the box under the drawing area and leave it blank. Click and drag to start drawing a structure. This reaction will not make a product with a new CC bond. G marrow_forwardIncluding activity coefficients, find [Hg22+] in saturated Hg2Br2 in 0.00100 M NH4 Ksp Hg2Br2 = 5.6×10-23.arrow_forward
- give example for the following(by equation) a. Converting a water insoluble compound to a soluble one. b. Diazotization reaction form diazonium salt c. coupling reaction of a diazonium salt d. indacator properties of MO e. Diazotization ( diazonium salt of bromobenzene)arrow_forward2-Propanone and ethyllithium are mixed and subsequently acid hydrolyzed. Draw and name the structures of the products.arrow_forward(Methanesulfinyl)methane is reacted with NaH, and then with acetophenone. Draw and name the structures of the products.arrow_forward
- 3-Oxo-butanenitrile and (E)-2-butenal are mixed with sodium ethoxide in ethanol. Draw and name the structures of the products.arrow_forwardWhat is the reason of the following(use equations if possible) a.) In MO preperation through diazotization: Addition of sodium nitrite in acidfied solution in order to form diazonium salt b.) in MO experiment: addition of sodium hydroxide solution in the last step to isolate the product MO. What is the color of MO at low pH c.) In MO experiment: addition of sodium hydroxide solution in the last step to isolate the product MO. What is the color of MO at pH 4.5 d.) Avoiding not cooling down the reaction mixture when preparing the diazonium salt e.) Cbvcarrow_forwardA 0.552-g sample of an unknown acid was dissolved in water to a total volume of 20.0 mL. This sample was titrated with 0.1103 M KOH. The equivalence point occurred at 29.42 mL base added. The pH of the solution at 10.0 mL base added was 3.72. Determine the molar mass of the acid. Determine the Ka of the acid.arrow_forward
 Introductory Chemistry: A FoundationChemistryISBN:9781337399425Author:Steven S. Zumdahl, Donald J. DeCostePublisher:Cengage Learning
 Chemistry: Principles and PracticeChemistryISBN:9780534420123Author:Daniel L. Reger, Scott R. Goode, David W. Ball, Edward MercerPublisher:Cengage Learning
 ChemistryChemistryISBN:9781305957404Author:Steven S. Zumdahl, Susan A. Zumdahl, Donald J. DeCostePublisher:Cengage Learning
 Chemistry: An Atoms First ApproachChemistryISBN:9781305079243Author:Steven S. Zumdahl, Susan A. ZumdahlPublisher:Cengage Learning
 Chemistry: The Molecular ScienceChemistryISBN:9781285199047Author:John W. Moore, Conrad L. StanitskiPublisher:Cengage Learning


