Exercises 57 and 58 refer to the mode of a data set. The mode of a data set is the data point that occurs with the highest frequency. When there are several data points (or categories) tied for the most frequent, each of them is a mode, but if all data points have the same frequency, rather than say that every data point is a mode, it is customary to say that there is no mode. 1. Find the mode of the data set given by Table 15-20 ( Exercise 30 ). 2. Find the mode of the data set given by Fig. 15-15 (Exercises 11 and 12). Table 15-20 shows ages of the firefighters in the Cleansburg fire department. Table 15-20 Age 25 27 28 29 30 Frequency 2 7 6 9 15 Age 31 32 33 37 39 Frequency 12 9 9 6 4 Exercises 11 and 12 refer to the bar graph shown in Fig. 15-15 describing the scores of a group of students on a 10-point math quiz.
Exercises 57 and 58 refer to the mode of a data set. The mode of a data set is the data point that occurs with the highest frequency. When there are several data points (or categories) tied for the most frequent, each of them is a mode, but if all data points have the same frequency, rather than say that every data point is a mode, it is customary to say that there is no mode. 1. Find the mode of the data set given by Table 15-20 ( Exercise 30 ). 2. Find the mode of the data set given by Fig. 15-15 (Exercises 11 and 12). Table 15-20 shows ages of the firefighters in the Cleansburg fire department. Table 15-20 Age 25 27 28 29 30 Frequency 2 7 6 9 15 Age 31 32 33 37 39 Frequency 12 9 9 6 4 Exercises 11 and 12 refer to the bar graph shown in Fig. 15-15 describing the scores of a group of students on a 10-point math quiz.
Solution Summary: The author explains that the mode of a data set is the data point that occurs with the highest frequency. If all data points have the same frequency, it is customary to say that there is no mode.
Exercises 57 and 58 refer to the mode of a data set. The mode of a data set is the data point that occurs with the highest frequency. When there are several data points (or categories) tied for the most frequent, each of them is a mode, but if all data points have the same frequency, rather than say that every data point is a mode, it is customary to say that there is no mode.
1. Find the mode of the data set given by Table 15-20 (Exercise 30).
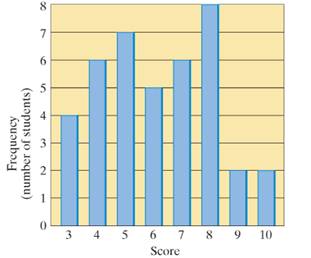
2. Find the mode of the data set given by Fig. 15-15 (Exercises 11 and 12).
Table 15-20 shows ages of the firefighters in the Cleansburg fire department.
Table 15-20
Age
25
27
28
29
30
Frequency
2
7
6
9
15
Age
31
32
33
37
39
Frequency
12
9
9
6
4
Exercises 11 and 12 refer to the bar graph shown in Fig. 15-15 describing the scores of a group of students on a 10-point math quiz.
100 identical balls are rolling along a straight line. They all have speed equal to v, but some of them might move in opposite directions. When two of them collide they immediately switch their direction and keep the speed v. What is the maximum number of collisions that can happen?
Let f(w) be a function of vector w Є RN, i.e. f(w) = 1+e Determine the first derivative and matrix of second derivatives off with respect to w.
Let A Є RN*N be a symmetric, positive definite matrix and bЄ RN a vector. If x ER, evaluate the integral Z(A,b) = e¯xAx+bx dx as a function of A and b.
John throws a fair die with faces labelled 1 to 6. ⚫ He gains 10 points if the die shows 1. ⚫ He gains 1 point if the die shows 2 or 4. • No points are allocated otherwise. Let X be the random variable describing John's gain at each throw. Determine the variance of X.
A 20 lb horizontal force P acts on a bell crank as shown below. (a) Replace P with an equivalent force-couple system at B. (b) Find the two vertical forces at C and D which are equivalent to the couple found in part a
Need a deep-dive on the concept behind this application? Look no further. Learn more about this topic, subject and related others by exploring similar questions and additional content below.


 Holt Mcdougal Larson Pre-algebra: Student Edition...AlgebraISBN:9780547587776Author:HOLT MCDOUGALPublisher:HOLT MCDOUGAL
 Glencoe Algebra 1, Student Edition, 9780079039897...AlgebraISBN:9780079039897Author:CarterPublisher:McGraw Hill
 Functions and Change: A Modeling Approach to Coll...AlgebraISBN:9781337111348Author:Bruce Crauder, Benny Evans, Alan NoellPublisher:Cengage Learning
 Big Ideas Math A Bridge To Success Algebra 1: Stu...AlgebraISBN:9781680331141Author:HOUGHTON MIFFLIN HARCOURTPublisher:Houghton Mifflin Harcourt