
MYLAB MATH FOR EXCURSIONS IN MATHEMATIC
9th Edition
ISBN: 9780136415893
Author: Tannenbaum
expand_more
expand_more
format_list_bulleted
Concept explainers
Videos
Textbook Question
Chapter 15, Problem 46E
Exercises 45 and 46 refer to the two box plots in Fig. 15-18 showing the starting salaries of Tasmania State University first-year graduates in agriculture and engineering. (These are the two box plots discussed in Example 15.15.)
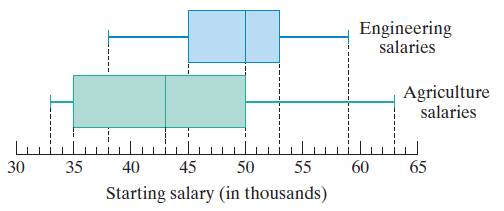
Figure 15-18
a. Fill in the blank: Of the 612 engineering graduates, at most had a starting salary greater than
b. Fill in the blank: If there were 240 agriculture graduates with starting salaries of
Expert Solution & Answer
Want to see the full answer?
Check out a sample textbook solution
Students have asked these similar questions
Please solve and explain
i need help please hand written
Not use ai please
Chapter 15 Solutions
MYLAB MATH FOR EXCURSIONS IN MATHEMATIC
Ch. 15 - Exercises 1 through 4 refer to the data set shown...Ch. 15 - Exercises 1 through 4 refer to the data set shown...Ch. 15 - Exercises 1 through 4 refer to the data set shown...Ch. 15 - Exercises 1 through 4 refer to the data set shown...Ch. 15 - Exercises 5 through 10 refer to Table 15-13, which...Ch. 15 - Exercises 5 through 10 refer to Table 15-13, which...Ch. 15 - Exercises 5 through 10 refer to Table 15-13, which...Ch. 15 - Exercise 5 through 10 refer to Table 15-13, which...Ch. 15 - Exercise 5 through 10 refer to Table 15-13, which...Ch. 15 - Exercise 5 through 10 refer to Table 15-13, which...
Ch. 15 - Exercise 11 and 12 refer to the bar graph shown in...Ch. 15 - Exercise 11 and 12 refer to the bar graph shown in...Ch. 15 - Exercise 13 and 14 refer to the pie chart in Fig....Ch. 15 - Exercise 13 and 14 refer to the pie chart in Fig....Ch. 15 - Table 15-14 shows the class interval frequencies...Ch. 15 - Table 15-15 shows the class interval frequencies...Ch. 15 - Table 15-16 shows the percentage of U.S. working...Ch. 15 - Table 15-17 shows the percentage of U.S. workers...Ch. 15 - Exercises 19 and 20 refer to Table 15-18, which...Ch. 15 - More than Less than or equal to Number of babies...Ch. 15 - Exercises 21 and 22 refer to the two histograms...Ch. 15 - Exercises 21 and 22 refer to the two histograms...Ch. 15 - Consider the data set {3,5,7,4,8,2,8,3,6}. a.Find...Ch. 15 - Consider the data set {4,6,8,5.2,10.4,10,12.6,13}...Ch. 15 - Find the average A and median M of each of the...Ch. 15 - Find the average A and median M of each of the...Ch. 15 - Find the average A and median M of each of the...Ch. 15 - Find the average A and median M of each of the...Ch. 15 - Table 15-19 shows the results of a 5-point musical...Ch. 15 - Table 15-20 shows the ages of the firefighters in...Ch. 15 - Table 15-21 shows the relative frequencies of the...Ch. 15 - Table 15-22 shows the relative frequencies of the...Ch. 15 - Consider the data set {5,7,4,8,2,8,3,6}. a. Find...Ch. 15 - Consider the data set {4,6,8,5.2,10.4,10,12.6,13}....Ch. 15 - For each data set, find the 75th and the 90th...Ch. 15 - For each data set, find the 10th and the 25th...Ch. 15 - Table 15-20 Age 25 27 28 29 30 Frequency 2 7 6 9...Ch. 15 - This exercise refers to the math quiz scores shown...Ch. 15 - Prob. 39ECh. 15 - Exercise 39 and 40 refer to SAT test scores for...Ch. 15 - Consider the data set {5,7,4,8,2,8,3,6}. a. Find...Ch. 15 - Consider the data set {4,6,8,5.2,10.4,10,12.6,13}....Ch. 15 - Prob. 43ECh. 15 - This exercise refers to the distribution of the...Ch. 15 - Exercises 45 and 46 refer to the two box plots in...Ch. 15 - Exercises 45 and 46 refer to the two box plots in...Ch. 15 - For the data set {5,7,4,8,2,8,3,6}, find a. the...Ch. 15 - For the data set {4,6,8,5.2,10.4,10,12.6,13}, find...Ch. 15 - A realty company has sold N=341 homes in the last...Ch. 15 - Exercise 45 and 46 refer to the box plot in...Ch. 15 - Prob. 51ECh. 15 - For Exercises 51 through 54, you should use the...Ch. 15 - For Exercises 51 through 54, you should use the...Ch. 15 - For Exercises 51 through 54, you should use the...Ch. 15 - The purpose of Exercises 55 and 56 is to practice...Ch. 15 - The purpose of Exercises 55 and 56 is to practice...Ch. 15 - Exercises 57 and 58 refer to the mode of a data...Ch. 15 - Exercises 57 and 58 refer to the mode of a data...Ch. 15 - Mikes average on the first five exams in Econ 1A...Ch. 15 - Explain each of the following statements regarding...Ch. 15 - In 2006, the median SAT score was the average of...Ch. 15 - In 2004, the third quartile SAT scores was...Ch. 15 - Prob. 63ECh. 15 - Suppose that the average of 10 numbers is 7.5 and...Ch. 15 - Prob. 65ECh. 15 - What happens to the five-number summary of the...Ch. 15 - Prob. 67ECh. 15 - Prob. 68ECh. 15 - Prob. 69ECh. 15 - Prob. 70ECh. 15 - Prob. 71ECh. 15 - Prob. 72ECh. 15 - Prob. 73ECh. 15 - Suppose that the standard deviation of the data...Ch. 15 - Chebyshevs theorem. The Russian mathematician P.L....
Knowledge Booster


Learn more about
Need a deep-dive on the concept behind this application? Look no further. Learn more about this topic, subject and related others by exploring similar questions and additional content below.Similar questions
- i need help please hand writtenarrow_forwardneed help with part barrow_forwarddent Application X GA spinner is divided into five cox | + 9/26583471/4081d162951bfdf39e254aa2151384b7 A spinner is divided into five colored sections that are not of equal size: red, blue, green, yellow, and purple. The spinner is spun several times, and the results are recorded below: Spinner Results Color Frequency Red 5 Blue 11 Green 18 Yellow 5 Purple 7 Based on these results, express the probability that the next spin will land on purple as a fraction in simplest form. Answer Attempt 1 out of 2 Submit Answer 0 Feb 12 10:11 Oarrow_forward
- Question 4 Calculate the Moment about the point D in Nx m B 500 N A 2 m 300 N 10 E 1.2 m 0.5 m D 0.8 m 200 N Carrow_forwardQuestion 6 Calculate the Moment about the point C in Nx m B A 2 m 500 N 1.2 m 0.8 m 300 N C 7arrow_forwardQuestion 2 Calculate the Moment about the point A in Nx m B 500 N A 2 m 300 N 10 E 1.2 m 0.5 m D 0.8 m 200 N Carrow_forward
- Question 3 Calculate the Moment about the point B in Nxm A 300 N 2 m 500 N 4 B с 0.8 m 1.2 marrow_forwardQuestion 5 Calculate the Moment about the point B in Nx m B 500 N A 2 m 1.2 m 0.8 m 300 N 7arrow_forwardQuestion 1 Calculate the Moment about the point A in Nx m A 300 N 2 m 500 N 4 B C 0.8 m 1.2 marrow_forward
arrow_back_ios
SEE MORE QUESTIONS
arrow_forward_ios
Recommended textbooks for you
 Holt Mcdougal Larson Pre-algebra: Student Edition...AlgebraISBN:9780547587776Author:HOLT MCDOUGALPublisher:HOLT MCDOUGAL
 Functions and Change: A Modeling Approach to Coll...AlgebraISBN:9781337111348Author:Bruce Crauder, Benny Evans, Alan NoellPublisher:Cengage Learning
Holt Mcdougal Larson Pre-algebra: Student Edition...
Algebra
ISBN:9780547587776
Author:HOLT MCDOUGAL
Publisher:HOLT MCDOUGAL
Functions and Change: A Modeling Approach to Coll...
Algebra
ISBN:9781337111348
Author:Bruce Crauder, Benny Evans, Alan Noell
Publisher:Cengage Learning
Mod-01 Lec-01 Discrete probability distributions (Part 1); Author: nptelhrd;https://www.youtube.com/watch?v=6x1pL9Yov1k;License: Standard YouTube License, CC-BY
Discrete Probability Distributions; Author: Learn Something;https://www.youtube.com/watch?v=m9U4UelWLFs;License: Standard YouTube License, CC-BY
Probability Distribution Functions (PMF, PDF, CDF); Author: zedstatistics;https://www.youtube.com/watch?v=YXLVjCKVP7U;License: Standard YouTube License, CC-BY
Discrete Distributions: Binomial, Poisson and Hypergeometric | Statistics for Data Science; Author: Dr. Bharatendra Rai;https://www.youtube.com/watch?v=lHhyy4JMigg;License: Standard Youtube License