(a)
Interpretation:
The order of the reaction should be determined with respect to oxygen atoms.
Concept Introduction:
Rate Law can be expressed as an integrated rate law and a differential rate law.
Differential Rate Law: This describes the change in the concentrations of reactant as a function of time.
Integrated Rate Law: This describes the initial concentrations and the measured concentration of one or more reactants as a function of time.
(a)
Answer to Problem 36E
The reaction is first order reaction with respect to oxygen.
Explanation of Solution
Given information:
Data is given as:
| Time (s) | |
| 0 | |
The order of reaction can be determined by plotting the graph between
For first order reaction:
For second order reaction:
For zero order reaction:
The given reaction is:
Now, if the reaction is first order with respect to oxygen, then the integrated law is expressed as:
If the reaction is second order with respect to oxygen, then the integrated law is expressed as:
If the reaction is zero order with respect to oxygen, then the integrated law is expressed as:
| Time (s) | ||
| 0 | 22.3327 | |
| 21.36512 | ||
| 20.3376 | ||
| 19.33697 |
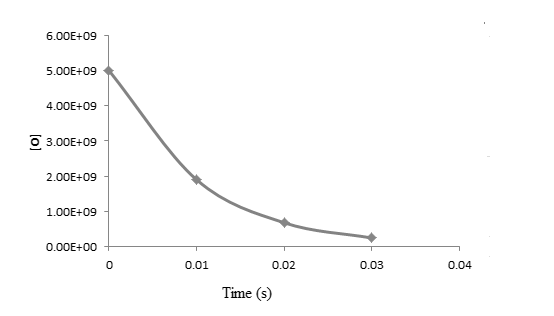
The graph between
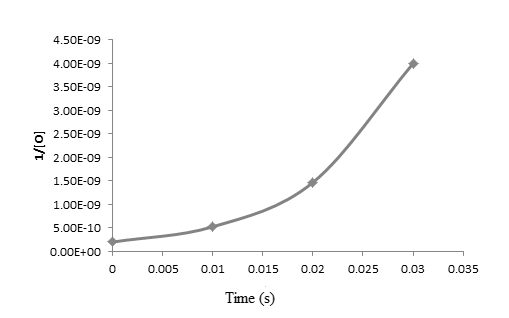
 The graph between

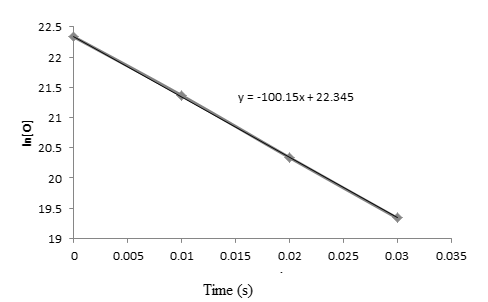
The graph between

From the above graphs, it is clear that the reaction is first order reaction with respect to oxygen as the graph is straight line graph.
(b)
Interpretation:
The overall rate law and value of rate constant should be calculated.
Concept Introduction:
Rate Law can be expressed as an integrated rate law and a differential rate law.
Differential Rate Law: This describes the change in the concentrations of reactant as a function of time.
Integrated Rate Law: This describes the initial concentrations and the measured concentration of one or more reactants as a function of time.
(b)
Answer to Problem 36E
Rate law is expressed as:
Since, concentration of nitrogen dioxide is more in comparison to oxygen, thus, rate law is written as:
Rate constant for first order reaction is
Explanation of Solution
Given information:
Data is given as:
| Time (s) | |
| 0 | |
The order of reaction can be determined by plotting the graph between
For first order reaction:
For second order reaction:
For zero order reaction:
The given reaction is:
Rate Law for first is expressed as:
Since, it is given that nitrogen dioxide is present in large amount in comparison to oxygen.
Thus, rate law is expressed as:
Where,
Now, from the graph slope is given as:
Slope =
Put the values from graph,
Slope =
Slope =
Thus, value of
Now,
Put the values,
Thus, rate constant for first order reaction is
Want to see more full solutions like this?
Chapter 15 Solutions
Chemical Principles
- Complete the following esterification reaction by drawing the structural formula of the product formed. HOH HO i catalyst catalyst OH HO (product has rum flavor) (product has orange flavor)arrow_forwardThe statements in the tables below are about two different chemical equilibria. The symbols have their usual meaning, for example AG stands for the standard Gibbs free energy of reaction and K stands for the equilibrium constant. In each table, there may be one statement that is faise because it contradicts the other three statements. If you find a false statement, check the box next to t Otherwise, check the "no false statements" box under the table. statement false? AG"1 no false statements: statement false? AG-0 0 InK-0 0 K-1 0 AH-TAS no false statements 2arrow_forwardComplete the following esterification reactions by drawing the line formulas of the carboxylic acid and alcohol required to form the ester shown. catalyst catalyst catalyst apricot fragrancearrow_forward
- Show the saponification products of the following ester: You don't need to draw in the Na+ cation. catalyst, A catalyst, A catalyst, Aarrow_forwardWhat would happen if the carboxylic acid and alcohol groups were on the same molecule? In essence, the molecule reacts with itself. Draw the structure of the products formed in this manner using the reactants below. If two functional groups interact with one another on the same molecule, this is called an “intramolecular" (within one) rather than "intermolecular" (between two or more) attack. OH OH catalyst OH HO catalyst catalyst HO OHarrow_forwardQ3: Write in the starting alkyl bromide used to form the following products. Include any reactants, reagents, and solvents over the reaction arrow. If more than one step is required, denote separate steps by using 1), 2), 3), etc. H OH racemic OH OH 5 racemicarrow_forward
- Draw the Lewis structure of the SO3-O(CH3)2 complex shown in the bottom right of slide 2in lecture 3-3 (“Me” means a CH3 group) – include all valence electron pairs and formal charges.From this structure, should the complex be a stable molecule? Explain.arrow_forwardPredict all organic product(s), including stereoisomers when applicable.arrow_forwardQ5: Propose a reasonable synthesis for the following decalin derivative. using only decalin and alkanes of 3 or fewer carbons. Decalin H3C HO க CH3arrow_forward
- 2Helparrow_forwardplease add appropriate arrows, and tell me clearly where to add arrows, or draw itarrow_forwardWhat I Have Learned Directions: Given the following reaction and the stress applied in each reaction, answer the question below. A. H2(g) + Cl2(g) 2 HCl(g) Stress applied: Decreasing the pressure 1. What is the Keq expression? 2. What will be the effect in the number of moles of HCl(g)? 3. What will be the Equilibrium Shift or the reaction? B. Fe3O4(s) + 4 H2(g) + heat 53 Fe(s) + 4 H₂O(g) Stress applied: Increasing the temperature 1. What is the Keq expression?. 2. What will be the effect in the volume of water vapor collected? 3. What will be the Equilibrium Shift or the reaction? C. 4 NH3(g) + 5 O2(g) 4 NO(g) + 6 H2O(g) + heat Stress applied: Increasing the volume of the container 1. What is the Keq expression?. 2. What will be the effect in the amount of H₂O? 3. What will be the Equilibrium Shift or the reaction?arrow_forward
 Chemistry for Engineering StudentsChemistryISBN:9781337398909Author:Lawrence S. Brown, Tom HolmePublisher:Cengage Learning
 Chemistry: The Molecular ScienceChemistryISBN:9781285199047Author:John W. Moore, Conrad L. StanitskiPublisher:Cengage Learning

