DATA You are measuring the frequency dependence of the average power P av transmitted by traveling waves on a wire. In your experiment you use a wire with linear mass density 3.5 g/m. For a transverse wave on the wire with amplitude 4.0 mm. you measure P av (in watts) as a function of the frequency f of the wave (in Hz). You have chosen to plot P av as a function of f 2 (Fig. F15.76 ). (a) Explain why values of P av plotted versus f 2 should be well fit by a straight line. (b) Use the slope of the straight-line fit to the data shown in Fig P15.76 to calculate the speed of the waves. (c) What angular frequency ω would result in P av = 10.0 W? Figure P15.76
DATA You are measuring the frequency dependence of the average power P av transmitted by traveling waves on a wire. In your experiment you use a wire with linear mass density 3.5 g/m. For a transverse wave on the wire with amplitude 4.0 mm. you measure P av (in watts) as a function of the frequency f of the wave (in Hz). You have chosen to plot P av as a function of f 2 (Fig. F15.76 ). (a) Explain why values of P av plotted versus f 2 should be well fit by a straight line. (b) Use the slope of the straight-line fit to the data shown in Fig P15.76 to calculate the speed of the waves. (c) What angular frequency ω would result in P av = 10.0 W? Figure P15.76
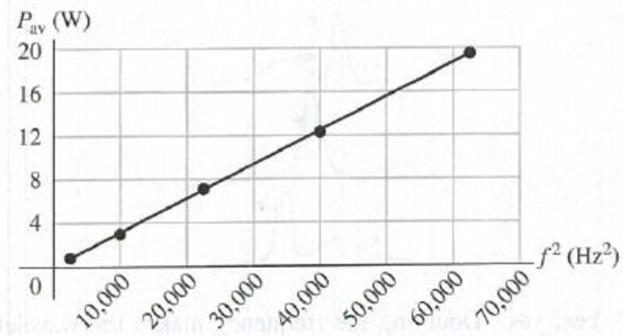
DATA You are measuring the frequency dependence of the average power Pav transmitted by traveling waves on a wire. In your experiment you use a wire with linear mass density 3.5 g/m. For a transverse wave on the wire with amplitude 4.0 mm. you measure Pav (in watts) as a function of the frequency f of the wave (in Hz). You have chosen to plot Pav as a function of f2 (Fig. F15.76). (a) Explain why values of Pav plotted versus f2 should be well fit by a straight line. (b) Use the slope of the straight-line fit to the data shown in Fig P15.76 to calculate the speed of the waves. (c) What angular frequency ω would result in Pav = 10.0 W?
A ball is thrown with an initial speed v, at an angle 6, with the horizontal. The horizontal range of the ball is R, and the ball reaches a maximum height R/4. In terms of R and g, find the following.
(a) the time interval during which the ball is in motion
2R
(b) the ball's speed at the peak of its path
v=
Rg 2
√ sin 26, V 3
(c) the initial vertical component of its velocity
Rg
sin ei
sin 20
(d) its initial speed
Rg
√ sin 20
×
(e) the angle 6, expressed in terms of arctan of a fraction.
1
(f) Suppose the ball is thrown at the same initial speed found in (d) but at the angle appropriate for reaching the greatest height that it can. Find this height.
hmax
R2
(g) Suppose the ball is thrown at the same initial speed but at the angle for greatest possible range. Find this maximum horizontal range.
Xmax
R√3
2
An outfielder throws a baseball to his catcher in an attempt to throw out a runner at home plate. The ball bounces once before reaching the catcher. Assume the angle at which the bounced ball leaves the ground is the same as the angle at which the outfielder threw it as shown in the figure, but that the ball's speed after the bounce is one-half of what it was before the bounce.
8
(a) Assuming the ball is always thrown with the same initial speed, at what angle & should the fielder throw the ball to make it go the same distance D with one bounce (blue path) as a ball thrown upward at 35.0° with no bounce (green path)?
24
(b) Determine the ratio of the time interval for the one-bounce throw to the flight time for the no-bounce throw.
Cone-bounce
no-bounce
0.940
Microbiology with Diseases by Body System (5th Edition)
Knowledge Booster
Learn more about
Need a deep-dive on the concept behind this application? Look no further. Learn more about this topic, physics and related others by exploring similar questions and additional content below.
Wave Speed on a String - Tension Force, Intensity, Power, Amplitude, Frequency - Inverse Square Law; Author: The Organic Chemistry Tutor;https://www.youtube.com/watch?v=vEzftaDL7fM;License: Standard YouTube License, CC-BY


 Physics for Scientists and Engineers: Foundations...PhysicsISBN:9781133939146Author:Katz, Debora M.Publisher:Cengage Learning
 University Physics Volume 1PhysicsISBN:9781938168277Author:William Moebs, Samuel J. Ling, Jeff SannyPublisher:OpenStax - Rice University
 Principles of Physics: A Calculus-Based TextPhysicsISBN:9781133104261Author:Raymond A. Serway, John W. JewettPublisher:Cengage Learning
 Classical Dynamics of Particles and SystemsPhysicsISBN:9780534408961Author:Stephen T. Thornton, Jerry B. MarionPublisher:Cengage Learning
 Glencoe Physics: Principles and Problems, Student...PhysicsISBN:9780078807213Author:Paul W. ZitzewitzPublisher:Glencoe/McGraw-Hill