Concept explainers
Videos
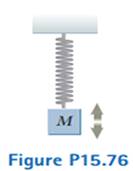
When a block of mass M, connected to the end of a spring of mass ms = 7.40 g and force constant k, is set into
A two-part experiment is
(a)
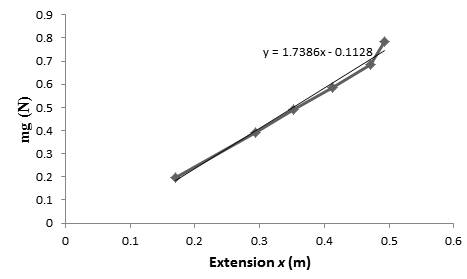
To draw: The graph of
Answer to Problem 15.76AP
The graph of
Explanation of Solution
Given info: The block of mass is
The values of mass and the static extension are given and calculate the value of the
| Static extension (x) in
| Mass (M) in
| Weight
|
| 0.17 | 0.02 | 0.196 |
| 0.293 | 0.04 | 0.392 |
| 0.353 | 0.05 | 0.49 |
| 0.413 | 0.06 | 0.588 |
| 0.471 | 0.07 | 0.686 |
| 0.493 | 0.08 | 0.784 |
Table (1)
Conclusion:
The table (1) indicates the values required to plot the graph of
Figure (1)
(b)
The value of
Answer to Problem 15.76AP
The value of
Explanation of Solution
Given info: The block of mass is
The equation of the graph is,
The slope intercept form of the equation of the line is,
Here,
Compare equation (1) and (2).
Since the slope of the graph indicates the force constant of the spring.
Conclusion:
Therefore, the value of
(c)
To draw: The table of given masses and the times.
Answer to Problem 15.76AP
The table of given masses and the times is,
| Mass in
| Time intervals in
|
| 20 | 7.03 |
| 40 | 9.62 |
| 50 | 10.67 |
| 60 | 11.67 |
| 70 | 12.52 |
| 80 | 13.41 |
Explanation of Solution
Given info: The block of mass is
The values of mass and the static extension are given and calculate the value of the
| Mass in
| Time intervals in
|
| 20 | 7.03 |
| 40 | 9.62 |
| 50 | 10.67 |
| 60 | 11.67 |
| 70 | 12.52 |
| 80 | 13.41 |
Table (2)
Conclusion:
The table (1) indicates the values of mass and the time intervals.
(d)
The experimental value for
Answer to Problem 15.76AP
The experimental values for
Explanation of Solution
Given info: The block of mass is
The expression for the time periods for each experiment is,
Here,
The ten experiments are conducted.
Calculate time periods for each experiment.
| Total time period
| Time period for one experiment
|
| 7.03 | 0.703 |
| 9.62 | 0.962 |
| 10.67 | 0.1067 |
| 11.67 | 1.167 |
| 12.52 | 1.252 |
| 13.41 | 1.341 |
Table (3)
Conclusion:
Therefore, the experimental values for
(e)
To draw: The graph of
Answer to Problem 15.76AP
The graph of
Explanation of Solution
Given info: The block of mass is
| Time period for one experiment
|
| Mass (M) in
|
| 0.703 | 0.494209 | 0.02 |
| 0.962 | 0.925444 | 0.04 |
| 0.1067 | 1.138489 | 0.05 |
| 1.167 | 1.361889 | 0.06 |
| 1.252 | 1.567504 | 0.07 |
| 1.341 | 1.798281 | 0.08 |
Table (4)
The table (4) indicates the values required to plot the graph of
Figure (2)
(f)
The value of
Answer to Problem 15.76AP
The value of
Explanation of Solution
Given info: The block of mass is
The equation of the graph is,
The given expression is,
Square both sides in above expression.
Compare equation (3) and (4).
Conclusion:
Therefore, the value of
(g)
The comparison in value of
Answer to Problem 15.76AP
The value of
Explanation of Solution
Given info: The block of mass is
The value of
The value of
Compare the values.
Conclusion:
Therefore, the value of
(h)
The value of
Answer to Problem 15.76AP
The value of
Explanation of Solution
Given info: The block of mass is
The equation of the graph is,
The given expression is,
Square both sides in above expression.
Compare both the above expression.
Substitute
Conclusion:
Therefore, the value of
Want to see more full solutions like this?
Chapter 15 Solutions
EBK PHYSICS FOR SCIENTISTS AND ENGINEER


- A thrown brick hits a window, but doesn't break it. Instead it reverses direction and ends down on the ground below the window. Since the brick didn't break the glass, we know: О The force of the brick on the glass > the force of the glass on the brick. О The force of the brick on the glass the force of the glass on the brick. = О The force of the brick on the glass < the force of the glass on the brick. О The brick didn't slow down as it broke the glass.arrow_forwardAlexandra (wearing rubber boots for traction) is attempting to drag her 32.6-kg Golden Retriever across the smooth ice by applying a horizontal force. What force must she apply to move the dog with a constant speed of 0.950 m/s? ☐ 31.0 lb. ☐ 319 kg. ○ Zero. 32.6 kg.arrow_forwardThe figure shows a graph of the acceleration of an object as a function of the net force acting on it. The mass of this object, in grams, is closest to 11 a(m/s²) 8.0+ 6.0- 4.0- 2.0- 0+ F(N) 0.00 0.50 1.00 ☐ 130 ○ 8000 ☐ 89arrow_forward
- Values that are within standard deviations represent measurements that are considered to be near the true value. Review the data from the lab and determine whether your data is within standard deviations. Report, using numerical values, whether your data for each angle is within standard deviations. An acceptable margin of error typically falls between 4% and 8% at the 95% confidence level. Review your data for each angle to determine whether the margin of error is within an acceptable range. Report with numerical values, whether your data for each angle is within an acceptable margin of error. Can you help explain what my data means in terms of the standard deviation and the ME? Thanks!arrow_forwardA sinusoidal wave is propagating along a stretched string that lies along the x-axis. The displacement of the string as a function of time is graphed in (Figure 1) for particles at x = 0 and at x = 0.0900 m. You are told that the two points x = 0 and x = 0.0900 m are within one wavelength of each other. If the wave is moving in the +x-direction, determine the wavelength. If instead the wave is moving in the -x-direction, determine the wavelength. Please show all stepsarrow_forwardYou are designing a two-string instrument with metal strings 35.0 cm long, as shown in (Figure 1). Both strings are under the same tension. String S1 has a mass of 8.30 g and produces the note middle C (frequency 262 Hz ) in its fundamental mode. What should be the tension in the string? What should be the mass of string S2 so that it will produce A-sharp (frequency 466 Hz ) as its fundamental? To extend the range of your instrument, you include a fret located just under the strings but not normally touching them. How far from the upper end should you put this fret so that when you press S1 tightly against it, this string will produce C-sharp (frequency 277 Hz ) in its fundamental? That is, what is x in the figure? If you press S2 against the fret, what frequency of sound will it produce in its fundamental?arrow_forward
- Please solve and answer the problem correctly please. Thank you!!arrow_forwardPlease help explain this. The experiment without the sandpaper had a 5% experimental error, with sandpaper it is 9.4%. Would the explaination be similar to the experiment without sandpaper? Thanks!arrow_forwardA sinusoidal wave with wavelength 0.400 m travels along a string. The maximum transverse speed of a point on the string is 3.00 m/s and the maximum transverse acceleration is 8.10×10⁴m/s2. What is the propagation speed v of the wave? What is the amplitude A of the wave?arrow_forward
 Physics for Scientists and Engineers, Technology ...PhysicsISBN:9781305116399Author:Raymond A. Serway, John W. JewettPublisher:Cengage Learning
 Physics for Scientists and Engineers: Foundations...PhysicsISBN:9781133939146Author:Katz, Debora M.Publisher:Cengage Learning
 Principles of Physics: A Calculus-Based TextPhysicsISBN:9781133104261Author:Raymond A. Serway, John W. JewettPublisher:Cengage Learning
 Physics for Scientists and Engineers with Modern ...PhysicsISBN:9781337553292Author:Raymond A. Serway, John W. JewettPublisher:Cengage Learning
 Physics for Scientists and EngineersPhysicsISBN:9781337553278Author:Raymond A. Serway, John W. JewettPublisher:Cengage Learning
 College PhysicsPhysicsISBN:9781305952300Author:Raymond A. Serway, Chris VuillePublisher:Cengage Learning