
Modern Business Statistics with Microsoft Office Excel (with XLSTAT Education Edition Printed Access Card) (MindTap Course List)
6th Edition
ISBN: 9781337115186
Author: David R. Anderson, Dennis J. Sweeney, Thomas A. Williams, Jeffrey D. Camm, James J. Cochran
Publisher: Cengage Learning
expand_more
expand_more
format_list_bulleted
Concept explainers
Videos
Textbook Question
Chapter 14.2, Problem 6E
The National Football League (NFL) records a variety of performance data for individuals and teams. To investigate the importance of passing on the percentage of games won by a team, the following data show the average number of passing yards per attempt (Yds/Att) and the percentage of games won (WinPct) in a season for a random sample of 10 NFL teams.
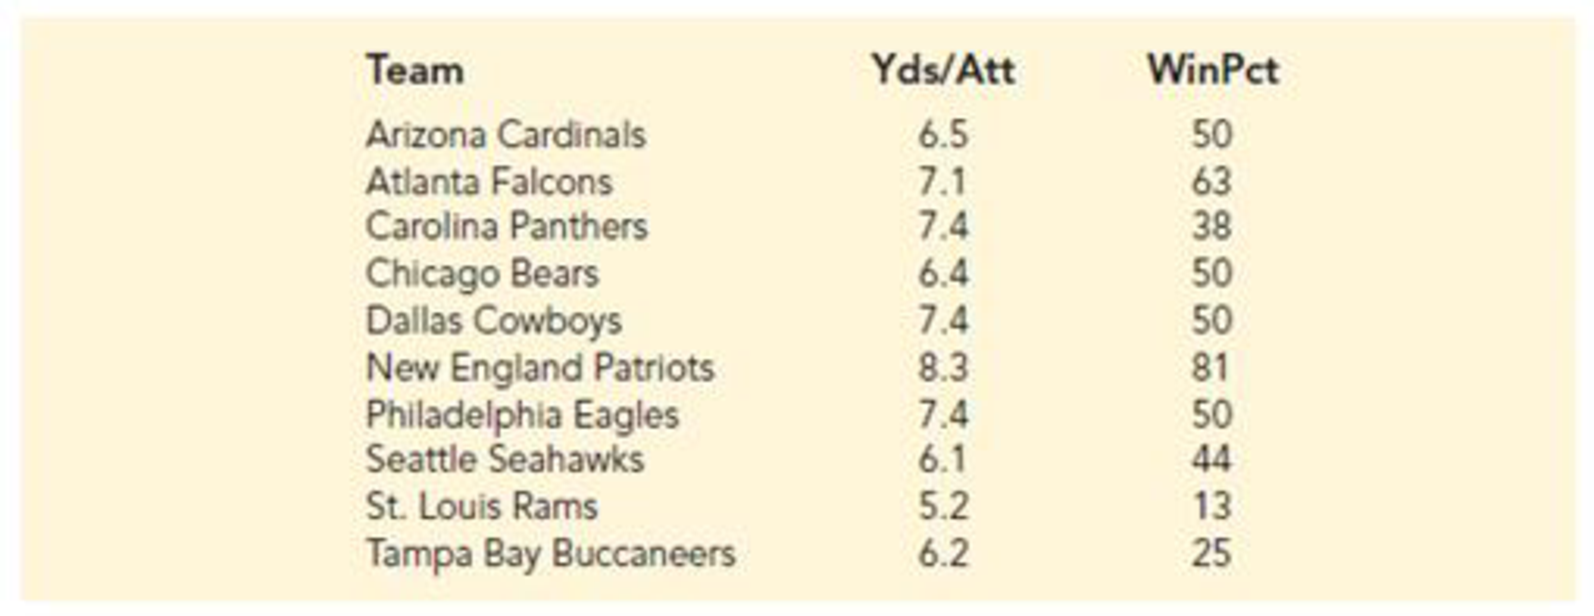
- a. Develop a
scatter diagram with the number of passing yards per attempt on the horizontal axis and the percentage of games won on the vertical axis. - b. What does the scatter diagram developed in part (a) indicate about the relationship between the two variables?
- c. Develop the estimated regression equation that could be used to predict the percentage of games won given the average number of passing yards per attempt.
- d. Provide an interpretation for the slope of the estimated regression equation.
- e. For the 2011 season, the average number of passing yards per attempt for the Kansas City Chiefs was 6.2. Use the estimated regression equation developed in part (c) to predict the percentage of games won by the Kansas City Chiefs. (Note: For the 2011 season the Kansas City Chiefs record was 7 wins and 9 losses.) Compare your prediction to the actual percentage of games won by the Kansas City Chiefs.
Expert Solution & Answer
Want to see the full answer?
Check out a sample textbook solution
Students have asked these similar questions
Question 2
The data below provides the battery life of thirty eight (38) motorcycle batteries.
100 83 83 105 110 81 114
99 101 105 78 115 74 96
106
89
94 81 106 91 93 86
79 103 94 108 113 100
117 120
77 93
93 85 76
89 78 88
680
a. Test the hypothesis that mean battery life is greater than 90. Use the 1% level of
significance.
b. Determine if the mean battery life is different from 80. Use the 10% level of
significance. Show all steps for the hypothesis test
c. Would your conlcusion in part (b) change at the 5% level of significance? |
d. Confirm test results in part (b) using JASP. Note: All JASP input files and output
tables should be provided
Suppose that 80% of athletes at a certain college graduate. You randomly select eight athletes. What’s the chance that at most 7 of them graduate?
Suppose that you flip a fair coin four times. What’s the chance of getting at least one head?
Chapter 14 Solutions
Modern Business Statistics with Microsoft Office Excel (with XLSTAT Education Edition Printed Access Card) (MindTap Course List)
Ch. 14.2 - Given are five observations for two variables, x...Ch. 14.2 - Given are five observations for two variables, x...Ch. 14.2 - Given are five observations collected in a...Ch. 14.2 - Retail and Trade: Female Managers. The following...Ch. 14.2 - Production Line Speed and Quality Control. Brawdy...Ch. 14.2 - The National Football League (NFL) records a...Ch. 14.2 - Sales Experience and Performance. A sales manager...Ch. 14.2 - Broker Satisfaction. The American Association of...Ch. 14.2 - Companies in the U.S. car rental market vary...Ch. 14.2 - Age and the Price of Wine. For a particular red...
Ch. 14.2 - Laptop Ratings. To help consumers in purchasing a...Ch. 14.2 - Stock Beta. In June of 2016, Yahoo Finance...Ch. 14.2 - Distance and Absenteeism. A large city hospital...Ch. 14.2 - Using a global-positioning-system (GPS)-based...Ch. 14.3 - 15. The data from exercise 1...Ch. 14.3 - The data from exercise 2 follow.
The estimated...Ch. 14.3 - Prob. 17ECh. 14.3 - Price and Quality of Headphones. The following...Ch. 14.3 - Sales Experience and Sales Performance. In...Ch. 14.3 - Price and Weight of Bicycles. Bicycling, the...Ch. 14.3 - Cost Estimation. An important application of...Ch. 14.3 - 22. Refer to exercise 9, where the following data...Ch. 14.5 - The data from exercise 1 follow.
Compute the mean...Ch. 14.5 - The data from exercise 2 follow.
Compute the mean...Ch. 14.5 - The data from exercise 3 follow.
What is the...Ch. 14.5 - Prob. 26ECh. 14.5 - To identify high-paying jobs for people who do not...Ch. 14.5 - Broker Satisfaction Conclusion. In exercise 8,...Ch. 14.5 - Cost Estimation Conclusion. Refer to exercise 21,...Ch. 14.5 - Significance of Fleet Size on Rental Car Revenue....Ch. 14.5 - Significance of Racing Bike Weight on Price. In...Ch. 14.6 - 32. The data from exercise 1...Ch. 14.6 - 33. The data from exercise 2...Ch. 14.6 - Prob. 34ECh. 14.6 - 35. The following data are the monthly salaries y...Ch. 14.6 - 36. In exercise 7, the data on y = annual sales ($...Ch. 14.6 - In exercise 5, the following data on x = the...Ch. 14.6 - Prob. 38ECh. 14.6 - 39. In exercise 12, the following data on x =...Ch. 14.7 - The commercial division of a real estate firm...Ch. 14.7 - Following is a portion of the regression output...Ch. 14.7 - Prob. 43ECh. 14.7 - Auto Racing Helmet. Automobile racing,...Ch. 14.8 - Prob. 45ECh. 14.8 - Prob. 46ECh. 14.8 - Prob. 47ECh. 14.8 - Prob. 48ECh. 14.8 - Prob. 49ECh. 14.9 - Consider the following data for two variables, x...Ch. 14.9 - Prob. 51ECh. 14.9 - Predicting Charity Expenses. Charity Navigator is...Ch. 14.9 - Many countries, especially those in Europe, have...Ch. 14.9 - Valuation of a Major League Baseball Team. The...Ch. 14 - The Dow Jones Industrial Average (DJIA) and the...Ch. 14 - Home Sire and Price. Is the number of square feet...Ch. 14 - Online Education. One of the biggest changes in...Ch. 14 - Machine Maintenance. Jensen Tire & Auto is in the...Ch. 14 - Bus Maintenance. The regional transit authority...Ch. 14 - Studying and Grades. A marketing professor at...Ch. 14 - Used Car Mileage and Price. The Toyota Camry is...Ch. 14 - One measure of the risk or volatility of an...Ch. 14 - As part of a study on transportation safety, the...Ch. 14 - Consumer Reports tested 166 different...Ch. 14 - When trying to decide what car to buy, real value...Ch. 14 - Buckeye Creek Amusement Park is open from the...
Knowledge Booster


Learn more about
Need a deep-dive on the concept behind this application? Look no further. Learn more about this topic, statistics and related others by exploring similar questions and additional content below.Similar questions
- Suppose that the chance that an elementary student eats hot lunch is 30 percent. What’s the chance that, among 20 randomly selected students, between 6 and 8 students eat hot lunch (inclusive)?arrow_forwardBob’s commuting times to work are varied. He makes it to work on time 80 percent of the time. On 12 randomly selected trips to work, what’s the chance that Bob makes it on time at least 10 times?arrow_forwardYour chance of winning a small prize in a scratch-off ticket is 10 percent. You buy five tickets. What’s the chance you will win at least one prize?arrow_forward
- Suppose that 60 percent of families own a pet. You randomly sample four families. What is the chance that two or three of them own a pet?arrow_forwardIf 40 percent of university students purchase their textbooks online, in a random sample of five students, what’s the chance that exactly one of them purchased their textbooks online?arrow_forwardA stoplight is green 40 percent of the time. If you stop at this light eight random times, what is the chance that it’s green exactly five times?arrow_forward
- If 10 percent of the parts made by a certain company are defective and have to be remade, what is the chance that a random sample of four parts has one that is defective?arrow_forwardQuestion 4 Fourteen individuals were given a complex puzzle to complete. The times in seconds was recorded for their first and second attempts and the results provided below: 1 2 3 first attempt 172 255 second attempt 70 4 5 114 248 218 194 270 267 66 6 7 230 219 341 174 8 10 9 210 261 347 218 200 281 199 308 268 243 236 300 11 12 13 14 140 302 a. Calculate a 95% confidence interval for the mean time taken by each individual to complete the (i) first attempt and (ii) second attempt. [la] b. Test the hypothesis that the difference between the two mean times for both is 100 seconds. Use the 5% level of significance. c. Subsequently, it was learnt that the times for the second attempt were incorrecly recorded and that each of the values is 50 seconds too large. What, if any, difference does this make to the results of the test done in part (b)? Show all steps for the hypothesis testarrow_forwardQuestion 3 3200 students were asked about the importance of study groups in successfully completing their courses. They were asked to provide their current majors as well as their opinion. The results are given below: Major Opinion Psychology Sociology Economics Statistics Accounting Total Agree 144 183 201 271 251 1050 Disagree 230 233 254 227 218 1162 Impartial 201 181 196 234 176 988 Total 575 597 651 732 645 3200 a. State both the null and alternative hypotheses. b. Provide the decision rule for making this decision. Use an alpha level of 5%. c. Show all of the work necessary to calculate the appropriate statistic. | d. What conclusion are you allowed to draw? c. Would your conclusion change at the 10% level of significance? f. Confirm test results in part (c) using JASP. Note: All JASP input files and output tables should be providedarrow_forward
- Question 1 A tech company has acknowledged the importance of having records of all meetings conducted. The meetings are very fast paced and requires equipment that is able to capture the information in the shortest possible time. There are two options, using a typewriter or a word processor. Fifteen administrative assistants are selected and the amount of typing time in hours was recorded. The results are given below: 1 2 3 4 5 6 7 8 9 10 11 12 13 14 15 typewriter 8.0 6.5 5.0 6.7 7.8 8.5 7.2 5.7 9.2 5.7 6.5 word processor 7.2 5.7 8.3 7.5 9.2 7.2 6.5 7.0 6.9 34 7.0 6.9 8.8 6.7 8.8 9.4 8.6 5.5 7.2 8.4 a. Test the hypothesis that the mean typing time in hours for typewriters is less than 7.0. Use the 1% level of significance. b. Construct a 90% confidence interval for the difference in mean typing time in hours, where a difference is equal to the typing time in hours of word processors minus typing time in hours of typewriter. c. Using the 5% significance level, determine whether there is…arrow_forwardIllustrate 2/7×4/5 using a rectangular region. Explain your work. arrow_forwardWrite three other different proportions equivalent to the following using the same values as in the given proportion 3 foot over 1 yard equals X feet over 5 yardsarrow_forward
arrow_back_ios
SEE MORE QUESTIONS
arrow_forward_ios
Recommended textbooks for you
 Big Ideas Math A Bridge To Success Algebra 1: Stu...AlgebraISBN:9781680331141Author:HOUGHTON MIFFLIN HARCOURTPublisher:Houghton Mifflin Harcourt
 Glencoe Algebra 1, Student Edition, 9780079039897...AlgebraISBN:9780079039897Author:CarterPublisher:McGraw Hill
 Holt Mcdougal Larson Pre-algebra: Student Edition...AlgebraISBN:9780547587776Author:HOLT MCDOUGALPublisher:HOLT MCDOUGAL
 Functions and Change: A Modeling Approach to Coll...AlgebraISBN:9781337111348Author:Bruce Crauder, Benny Evans, Alan NoellPublisher:Cengage Learning
Big Ideas Math A Bridge To Success Algebra 1: Stu...
Algebra
ISBN:9781680331141
Author:HOUGHTON MIFFLIN HARCOURT
Publisher:Houghton Mifflin Harcourt
Glencoe Algebra 1, Student Edition, 9780079039897...
Algebra
ISBN:9780079039897
Author:Carter
Publisher:McGraw Hill
Holt Mcdougal Larson Pre-algebra: Student Edition...
Algebra
ISBN:9780547587776
Author:HOLT MCDOUGAL
Publisher:HOLT MCDOUGAL
Functions and Change: A Modeling Approach to Coll...
Algebra
ISBN:9781337111348
Author:Bruce Crauder, Benny Evans, Alan Noell
Publisher:Cengage Learning
The Shape of Data: Distributions: Crash Course Statistics #7; Author: CrashCourse;https://www.youtube.com/watch?v=bPFNxD3Yg6U;License: Standard YouTube License, CC-BY
Shape, Center, and Spread - Module 20.2 (Part 1); Author: Mrmathblog;https://www.youtube.com/watch?v=COaid7O_Gag;License: Standard YouTube License, CC-BY
Shape, Center and Spread; Author: Emily Murdock;https://www.youtube.com/watch?v=_YyW0DSCzpM;License: Standard Youtube License