Modern Business Statistics with Microsoft Office Excel (with XLSTAT Education Edition Printed Access Card) (MindTap Course List)
6th Edition
ISBN: 9781337115186
Author: David R. Anderson, Dennis J. Sweeney, Thomas A. Williams, Jeffrey D. Camm, James J. Cochran
Publisher: Cengage Learning
expand_more
expand_more
format_list_bulleted
Concept explainers
Textbook Question
Chapter 14, Problem 61SE
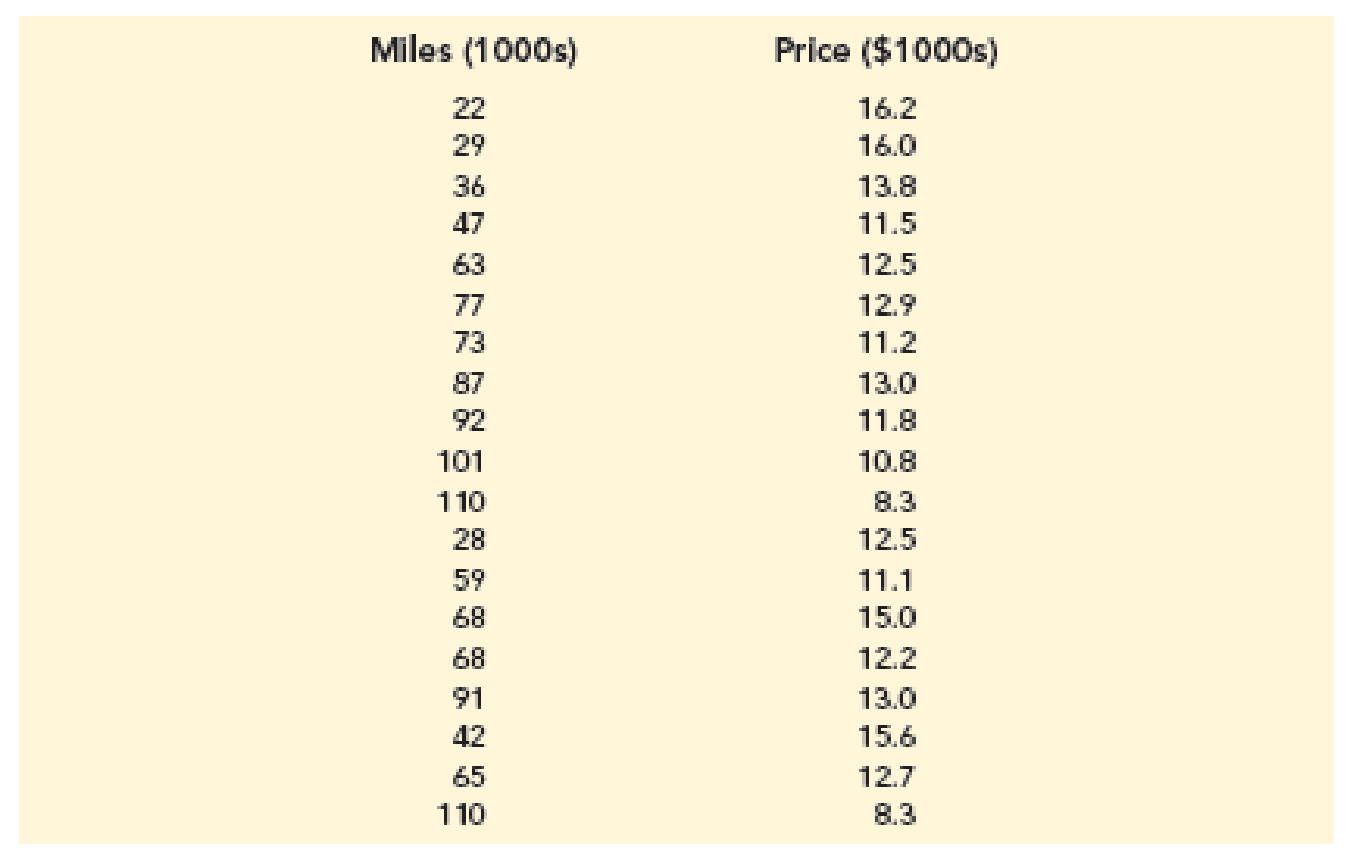
Used Car Mileage and Price. The Toyota Camry is one of the best-selling cars in North America. The cost of a previously owned Camry depends upon many factors, including the model year, mileage, and condition. To investigate the relationship between the car’s mileage and the sales price for a 2007 model year Camry, the following data show the mileage and sale price for 19 sales (PriceHub website).

- a. Develop a
scatter diagram with the car mileage on the horizontal axis and the price on the vertical axis. - b. What does the scatter diagram developed in part (a) indicate about the relationship between the two variables?
- c. Develop the estimated regression equation that could be used to predict the price ($ 1000s) given the miles (1000s).
- d. Test for a significant relationship at the .05 level of significance.
- e. Did the estimated regression equation provide a good fit? Explain.
- f. Provide an interpretation for the slope of the estimated regression equation.
- g. Suppose that you are considering purchasing a previously owned 2007 Camry that has been driven 60.000 miles. Using the estimated regression equation developed in part (c), predict the price for this car. Is this the price you would offer the seller?
Expert Solution & Answer
Trending nowThis is a popular solution!

Students have asked these similar questions
Instructions: Create a dimensional model for a particular business process involving
gym membership. A customer can sign up for a membership of say one, three, six or
twelve months. I want to make it easy to query to identify current members, members
who expired in the last month, members who renewed in the last month, those who are
pending expiry etc.
If I have a basic model with a fact table representing a gym membership say
start_date_key
end_date_key
membership_attribute_key
customer_atrribute_key
fee
with associated dimension table for date, membership attributes such as length,
customer attributes and so forth. On a particular day, the active members are those with
a start date before the day and an end date after that day. Those who will expire next
month are those where the end date is in a particular date range.
SQL Help
Use the following diagram relation to perform the normalization.
You need to provide the 2NF and 3NF.
Chapter 14 Solutions
Modern Business Statistics with Microsoft Office Excel (with XLSTAT Education Edition Printed Access Card) (MindTap Course List)
Ch. 14.2 - Given are five observations for two variables, x...Ch. 14.2 - Given are five observations for two variables, x...Ch. 14.2 - Given are five observations collected in a...Ch. 14.2 - Retail and Trade: Female Managers. The following...Ch. 14.2 - Production Line Speed and Quality Control. Brawdy...Ch. 14.2 - The National Football League (NFL) records a...Ch. 14.2 - Sales Experience and Performance. A sales manager...Ch. 14.2 - Broker Satisfaction. The American Association of...Ch. 14.2 - Companies in the U.S. car rental market vary...Ch. 14.2 - Age and the Price of Wine. For a particular red...
Ch. 14.2 - Laptop Ratings. To help consumers in purchasing a...Ch. 14.2 - Stock Beta. In June of 2016, Yahoo Finance...Ch. 14.2 - Distance and Absenteeism. A large city hospital...Ch. 14.2 - Using a global-positioning-system (GPS)-based...Ch. 14.3 - 15. The data from exercise 1...Ch. 14.3 - The data from exercise 2 follow.
The estimated...Ch. 14.3 - Prob. 17ECh. 14.3 - Price and Quality of Headphones. The following...Ch. 14.3 - Sales Experience and Sales Performance. In...Ch. 14.3 - Price and Weight of Bicycles. Bicycling, the...Ch. 14.3 - Cost Estimation. An important application of...Ch. 14.3 - 22. Refer to exercise 9, where the following data...Ch. 14.5 - The data from exercise 1 follow.
Compute the mean...Ch. 14.5 - The data from exercise 2 follow.
Compute the mean...Ch. 14.5 - The data from exercise 3 follow.
What is the...Ch. 14.5 - Prob. 26ECh. 14.5 - To identify high-paying jobs for people who do not...Ch. 14.5 - Broker Satisfaction Conclusion. In exercise 8,...Ch. 14.5 - Cost Estimation Conclusion. Refer to exercise 21,...Ch. 14.5 - Significance of Fleet Size on Rental Car Revenue....Ch. 14.5 - Significance of Racing Bike Weight on Price. In...Ch. 14.6 - 32. The data from exercise 1...Ch. 14.6 - 33. The data from exercise 2...Ch. 14.6 - Prob. 34ECh. 14.6 - 35. The following data are the monthly salaries y...Ch. 14.6 - 36. In exercise 7, the data on y = annual sales ($...Ch. 14.6 - In exercise 5, the following data on x = the...Ch. 14.6 - Prob. 38ECh. 14.6 - 39. In exercise 12, the following data on x =...Ch. 14.7 - The commercial division of a real estate firm...Ch. 14.7 - Following is a portion of the regression output...Ch. 14.7 - Prob. 43ECh. 14.7 - Auto Racing Helmet. Automobile racing,...Ch. 14.8 - Prob. 45ECh. 14.8 - Prob. 46ECh. 14.8 - Prob. 47ECh. 14.8 - Prob. 48ECh. 14.8 - Prob. 49ECh. 14.9 - Consider the following data for two variables, x...Ch. 14.9 - Prob. 51ECh. 14.9 - Predicting Charity Expenses. Charity Navigator is...Ch. 14.9 - Many countries, especially those in Europe, have...Ch. 14.9 - Valuation of a Major League Baseball Team. The...Ch. 14 - The Dow Jones Industrial Average (DJIA) and the...Ch. 14 - Home Sire and Price. Is the number of square feet...Ch. 14 - Online Education. One of the biggest changes in...Ch. 14 - Machine Maintenance. Jensen Tire & Auto is in the...Ch. 14 - Bus Maintenance. The regional transit authority...Ch. 14 - Studying and Grades. A marketing professor at...Ch. 14 - Used Car Mileage and Price. The Toyota Camry is...Ch. 14 - One measure of the risk or volatility of an...Ch. 14 - As part of a study on transportation safety, the...Ch. 14 - Consumer Reports tested 166 different...Ch. 14 - When trying to decide what car to buy, real value...Ch. 14 - Buckeye Creek Amusement Park is open from the...
Knowledge Booster
Learn more about
Need a deep-dive on the concept behind this application? Look no further. Learn more about this topic, statistics and related others by exploring similar questions and additional content below.Similar questions
- Want in detailarrow_forwardshould use Lucidchart to draw the ERD.arrow_forwardA college course may have one or more scheduled sections or may not have a scheduled section. Attributes of COURSE include Course ID, Course Name, and Units. Attributes of SECTION include Section Number and Semester ID. Semester ID is composed of two parts: Semester and Year. Section Number is an integer (such as 1 or 2) that distinguishes one section from another for the same course but does not uniquely identify a section. How did you model SECTION? Why did you choose this way versus alternative ways to model SECTION?arrow_forward
- Data Warehouse Fact Table: The Pine Valley Furniture Company is designing the fact table of a data warehouse to store its growing amount of transaction and product data. The total number of products sold by the company is 138. The company has a total of 98 retail stores. The company considers capturing monthly data over a period of 3 years. PVFC plans to use the data warehouse to track the sales of each product per store over the 3-year period. What is the estimated number of records to be stored in the fact table in PVFC's data warehouse? Enter your answer as a numeric integer in the nearby box.arrow_forwardT Shirt Sales t-shirt price quantity sold total revenue $15 400 $6,000 50 100 150 200 250 300 350 400 $10 $15 $17 $25arrow_forwardPlease let me know. thank you. please explain it well so I understand it.arrow_forward
- Functional Dependency & Normalization The table below lists customer/car hire data. Each customer may hire cars from various outlets throughout Glasgow. A car is registered at a particular outlet and can be hired out to a customer on a given date. carReg make model custNo custName hireDate outletNo outletLoc M565 0GD Tesla Model S C100 Smith, J 5/14/2018 101 San Francisco M565 0GD Tesla Model S C201 Helena, P 5/15/2016 101 San Francisco N734 TPR Nissan Sunny C100 Smith, J 5/16/2016 101 San Francisco M134 BRP Tesla Model S C313 Blatt, O 5/14/2018 102 Los Angeles M134 BRP Tesla Model S C100 Smith, J 5/20/2018 102 Los Angeles M611 0PQ Nissan Sunny C295 Alice, T 5/20/2018 102 Los Angeles Fig: Table 1 Identify the functional dependencies represented by the data shown in the table above. State any assumptions you make about the data. Using…arrow_forwardAn EMPLOYEE has only one JOB_CODE, but a JOB_CODE can be held by many EMPLOYEEs. An EMPLOYEE can participate in many PLANs, and any PLAN can be assigned to many EMPLOYEEs. Note also that the M:N relationship has been broken down into two 1:M relationships for which the BENEFIT table serves as the composite or bridge entity. Question: Create the ERD to show the relationships among EMPLOYEE, BENEFIT, JOB, and PLAN.arrow_forwardThe database stores data for a company XYZ that sells paint products. The company tracks the sale of products to customers. The database keeps data on customers, sales, products, which products are on which invoices, employees, the salary history of each employee, departments, product brands, vendors, and which vendors supply which product. Attached is pdf (Stage2 pdf) of the above ER Diagram In your group, you will need to submit the following for the above-given ER diagram: The given ER diagram has M:N relationship. Resolve the M:N relationships. Draw the Dependency Diagram that is in 3NF for each relation. For each relation show the level of Normalisation achieved, and for any not in Third Normal Form, explain why. Discuss PK and FK for each relation. Create a 3NF table for each relation. Relational data structures that translate the well-formed relation, which includes (as in the Workshop Slide: Session 7, Slide 18): relation names, attribute names and field types primary keys…arrow_forward
arrow_back_ios
SEE MORE QUESTIONS
arrow_forward_ios
Recommended textbooks for you
 Database Systems: Design, Implementation, & Manag...Computer ScienceISBN:9781305627482Author:Carlos Coronel, Steven MorrisPublisher:Cengage Learning
 Database Systems: Design, Implementation, & Manag...Computer ScienceISBN:9781285196145Author:Steven, Steven Morris, Carlos Coronel, Carlos, Coronel, Carlos; Morris, Carlos Coronel and Steven Morris, Carlos Coronel; Steven Morris, Steven Morris; Carlos CoronelPublisher:Cengage LearningNp Ms Office 365/Excel 2016 I NtermedComputer ScienceISBN:9781337508841Author:CareyPublisher:Cengage

Database Systems: Design, Implementation, & Manag...
Computer Science
ISBN:9781305627482
Author:Carlos Coronel, Steven Morris
Publisher:Cengage Learning

Database Systems: Design, Implementation, & Manag...
Computer Science
ISBN:9781285196145
Author:Steven, Steven Morris, Carlos Coronel, Carlos, Coronel, Carlos; Morris, Carlos Coronel and Steven Morris, Carlos Coronel; Steven Morris, Steven Morris; Carlos Coronel
Publisher:Cengage Learning

Np Ms Office 365/Excel 2016 I Ntermed
Computer Science
ISBN:9781337508841
Author:Carey
Publisher:Cengage
The Shape of Data: Distributions: Crash Course Statistics #7; Author: CrashCourse;https://www.youtube.com/watch?v=bPFNxD3Yg6U;License: Standard YouTube License, CC-BY
Shape, Center, and Spread - Module 20.2 (Part 1); Author: Mrmathblog;https://www.youtube.com/watch?v=COaid7O_Gag;License: Standard YouTube License, CC-BY
Shape, Center and Spread; Author: Emily Murdock;https://www.youtube.com/watch?v=_YyW0DSCzpM;License: Standard Youtube License