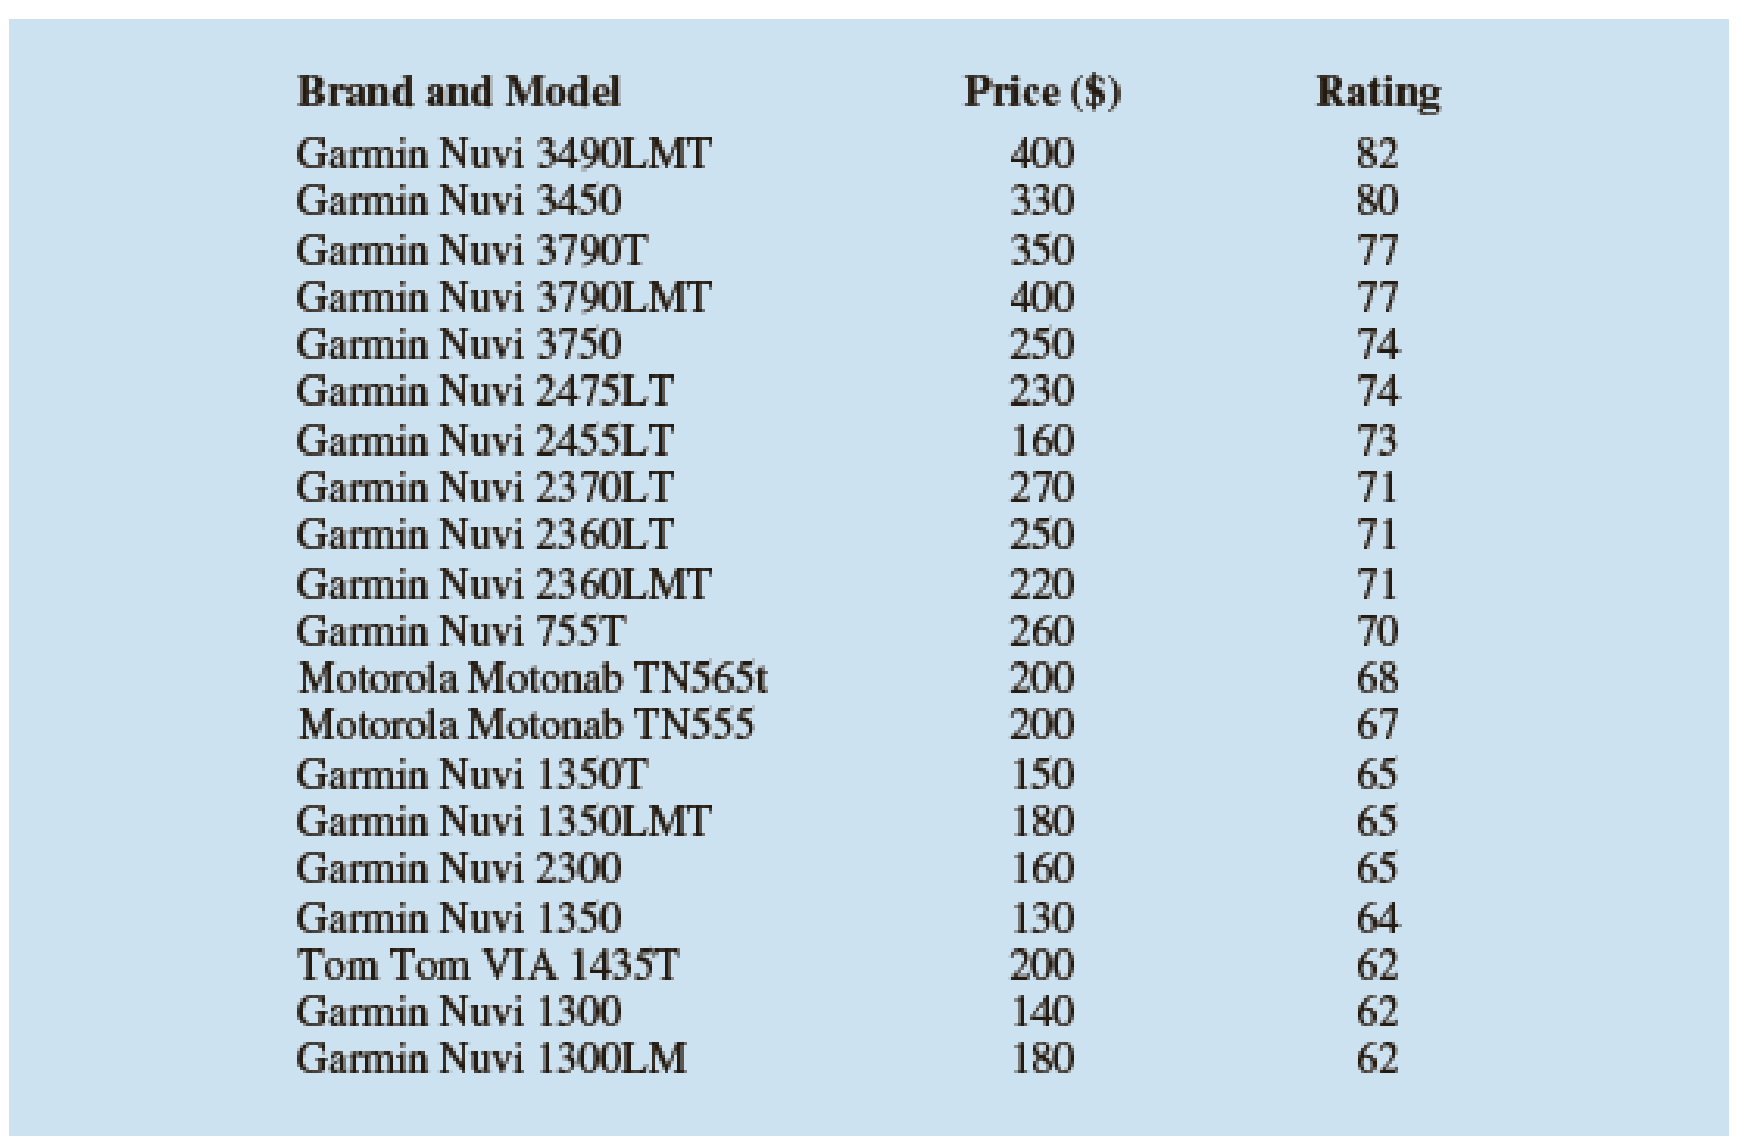
Using a global-positioning-system (GPS)-based navigator for your car, you enter a destination and the system will plot a route, give spoken turn-by-turn directions, and show your progress along the route. Today, even budget units include features previously available only on more expensive models. Consumer Reports conducted extensive tests of GPS-based navigators and developed an overall rating based on factors such as ease of use, driver information, display, and battery life. The following data show the price and rating for a sample of 20 GPS units with a 4.3-inch screen that Consumer Reports tested (Consumer Reports website, April 17, 2012).

- a. Develop a
scatter diagram with price as the independent variable. - b. What does the scatter diagram developed in part (a) indicate about the relationship between the two variables?
- c. Use the least squares method to develop the estimated regression equation.
- d. Predict the rating for a GPS system with a 4.3-inch screen that has a price of $200.
Want to see the full answer?
Check out a sample textbook solution
Chapter 14 Solutions
Modern Business Statistics with Microsoft Office Excel (with XLSTAT Education Edition Printed Access Card) (MindTap Course List)
- Discussion 1. Comment on your results. 2. Compare between the practical and theoretical results. 3. Find VB, Vc on the figure below: 3V V₁₁ R₁ B IR, R, IR, R www ΙΚΩ www www I 1.5KQ 18₁ 82002 R₁ 3.3KQ R₂ 2.2KQ E Darrow_forwardAgile1. a. Describe it and how it differs from other SDLC approachesb. List and describe the two primary terms for the agile processc. What are the three activities in the Construction phasearrow_forwardhow are youarrow_forward
- need help with thi Next, you are going to combine everything you've learned about HTML and CSS to make a static site portfolio piece. The page should first introduce yourself. The content is up to you, but should include a variety of HTML elements, not just text. This should be followed by an online (HTML-ified) version of your CV (Resume). The following is a minimum list of requirements you should have across all your content: Both pages should start with a CSS reset (imported into your CSS, not included in your HTML) Semantic use of HTML5 sectioning elements for page structure A variety other semantic HTML elements Meaningful use of Grid, Flexbox and the Box Model as appropriate for different layout components A table An image Good use of CSS Custom Properties (variables) Non-trivial use of CSS animation Use of pseudeo elements An accessible colour palette Use of media queries The focus of this course is development, not design. However, being able to replicate a provided design…arrow_forwardUsing the notationarrow_forwardyou can select multipy optionsarrow_forwardFor each of the following, decide whether the claim is True or False and select the True ones: Suppose we discover that the 3SAT can be solved in worst-case cubic time. Then it would mean that all problems in NP can also be solved in cubic time. If a problem can be solved using Dynamic Programming, then it is not NP-complete. Suppose X and Y are two NP-complete problems. Then, there must be a polynomial-time reduction from X to Y and also one from Y to X.arrow_forwardMaximum Independent Set problem is known to be NP-Complete. Suppose we have a graph G in which the maximum degree of each node is some constant c. Then, is the following greedy algorithm guaranteed to find an independent set whose size is within a constant factor of the optimal? 1) Initialize S = empty 2) Arbitrarily pick a vertex v, add v to S delete v and its neighbors from G 3) Repeat step 2 until G is empty Return S Yes Noarrow_forwardPlease help me answer this coding question in the images below for me(it is not a graded question):write the code using python and also provide the outputs requiredarrow_forwardWhat does the reduction showing Vertex Cover (VC) is NP-Complete do: Transforms any instance of VC to an instance of 3SAT Transforms any instance of 3SAT to an instance of VC Transforms any instance of VC to an instance of 3SAT AND transforms any instance of 3SAT to an instance of VC none of the abovearrow_forwardPlease assist me by writing out the code with its output (in python) using the information provided in the 2 images below.for the IP Address, it has been changed to: 172.21.5.204the serve code has not been open yet though but the ouput must be something along these lines(using command prompt):c:\Users\japha\Desktop>python "Sbongakonke.py"Enter the server IP address (127.0.0.1 or 172.21.5.199): 172.21.5.204Enter your student number: 4125035Connected to server!It's your turn to pour! Enter the amount to your pour (in mL):Please work it out until it gets the correct outputsNB: THIS QUESTION IS NOT A GRADED QUESTIONarrow_forwardneed help with a html code and css code that will match this image.arrow_forwardarrow_back_iosSEE MORE QUESTIONSarrow_forward_ios
- Np Ms Office 365/Excel 2016 I NtermedComputer ScienceISBN:9781337508841Author:CareyPublisher:Cengage
 Enhanced Discovering Computers 2017 (Shelly Cashm...Computer ScienceISBN:9781305657458Author:Misty E. Vermaat, Susan L. Sebok, Steven M. Freund, Mark Frydenberg, Jennifer T. CampbellPublisher:Cengage Learning
 Principles of Information Systems (MindTap Course...Computer ScienceISBN:9781305971776Author:Ralph Stair, George ReynoldsPublisher:Cengage Learning
  Systems ArchitectureComputer ScienceISBN:9781305080195Author:Stephen D. BurdPublisher:Cengage LearningCOMPREHENSIVE MICROSOFT OFFICE 365 EXCEComputer ScienceISBN:9780357392676Author:FREUND, StevenPublisher:CENGAGE L
 Principles of Information Systems (MindTap Course...Computer ScienceISBN:9781285867168Author:Ralph Stair, George ReynoldsPublisher:Cengage Learning


