Concept explainers
Videos
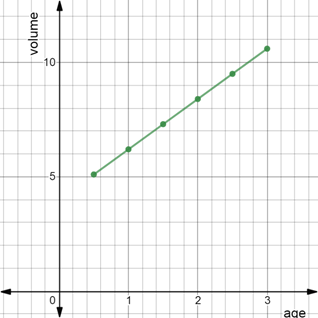
To graph: The volume as a function of age from the data provided between measurement of a growing plant. Also evaluate the equation of line in both point-slope and slope intercept form and volume on day
Explanation of Solution
Given information:
The table that provides relation between measurement of a growing plant.
Graph:
Consider the table that provides relation between measurement of a growing plant.
To graph the volume as a function of age, on the horizontal axis that is x- axis, plot the age and on vertical axis that is y -axis plot the volume.
Now plot the points
Interpretation:
The point slope form of a line is
The slope-intercept form of a line is
The slope is
Here independent variable is x and dependent variable is y.
According to the question, volumeV is dependent variable and age a is independent variable.
Slope of the line is evaluate when first two points are considered that is,
Slope of the line is
Equation of line in point slope form is, consider
Therefore, the equation in point-slope form is
Intercept on y -axis is 4 when compared with the equation in slope-intercept form
The above statement is interpreted as volume of the seed when age is 0 years is
Biologically this could be the volume of a new seedling.
Next, volume of seed on day
Therefore, volume is
Thus, equation in slope-intercept and point-slope form is
Want to see more full solutions like this?
Chapter 1 Solutions
Modeling the Dynamics of Life: Calculus and Probability for Life Scientists


- Suppose we have a linear program in standard equation form maximize cTx subject to Ax = b. x ≥ 0. and suppose u, v, and w are all optimal solutions to this linear program. (a) Prove that zu+v+w is an optimal solution. (b) If you try to adapt your proof from part (a) to prove that that u+v+w is an optimal solution, say exactly which part(s) of the proof go wrong. (c) If you try to adapt your proof from part (a) to prove that u+v-w is an optimal solution, say exactly which part(s) of the proof go wrong.arrow_forwarda) Suppose that we are carrying out the 1-phase simplex algorithm on a linear program in standard inequality form (with 3 variables and 4 constraints) and suppose that we have reached a point where we have obtained the following tableau. Apply one more pivot operation, indicating the highlighted row and column and the row operations you carry out. What can you conclude from your updated tableau? x1 x2 x3 81 82 83 84 81 -2 0 1 1 0 0 0 3 82 3 0 -2 0 1 2 0 6 12 1 1 -3 0 0 1 0 2 84 -3 0 2 0 0 -1 1 4 -2 -2 0 11 0 0-4 0 -8arrow_forwardPlease solve number 2.arrow_forward
- Construct a know-show table of the proposition: For each integer n, n is even if and only if 4 divides n^2arrow_forwardIn Problems 1 and 2 find the eigenfunctions and the equation that defines the eigenvalues for the given boundary-value problem. Use a CAS to approximate the first four eigenvalues A1, A2, A3, and A4. Give the eigenfunctions corresponding to these approximations. 1. y" + Ay = 0, y'(0) = 0, y(1) + y'(1) = 0arrow_forwardFind the closed formula for each of the following sequences (a_n)_n>=1 by realting them to a well known sequence. Assume the first term given is a_1 d. 5,23,119,719,5039 i have tried finding the differnces and the second difference and i still dont see the patternarrow_forward
- You manage a chemical company with 2 warehouses. The following quantities of Important Chemical A have arrived from an international supplier at 3 different ports: Chemical Available (L) Port 1 Port 2 Port 3 400 110 100 The following amounts of Important Chemical A are required at your warehouses: Warehouse 1 Warehouse 2 Chemical Required (L) 380 230 The cost in £ to ship 1L of chemical from each port to each warehouse is as follows: Warehouse 1 Warehouse 2 Port 1 £10 £45 Port 2 £20 £28 Port 3 £13 £11 (a) You want to know how to send these shipments as cheaply as possible. For- mulate this as a linear program (you do not need to formulate it in standard inequality form) indicating what each variable represents.arrow_forwarda) Suppose that we are carrying out the 1-phase simplex algorithm on a linear program in standard inequality form (with 3 variables and 4 constraints) and suppose that we have reached a point where we have obtained the following tableau. Apply one more pivot operation, indicating the highlighted row and column and the row operations you carry out. What can you conclude from your updated tableau? x1 12 23 81 82 83 S4 $1 -20 1 1 0 0 0 3 82 3 0 -2 0 1 2 0 6 12 1 1 -3 0 0 1 0 2 84 -3 0 2 0 0 -1 1 4 2 -2 0 11 0 0 -4 0 -8 b) Solve the following linear program using the 2-phase simplex algorithm. You should give the initial tableau and each further tableau produced during the execution of the algorithm. If the program has an optimal solution, give this solution and state its objective value. If it does not have an optimal solution, say why. maximize 21 - - 2x2 + x3 - 4x4 subject to 2x1+x22x3x4≥ 1, 5x1+x2-x3-4 -1, 2x1+x2-x3-342, 1, 2, 3, 4 ≥0.arrow_forwardSuppose we have a linear program in standard equation form maximize c'x subject to Ax=b, x≥ 0. and suppose u, v, and w are all optimal solutions to this linear program. (a) Prove that zu+v+w is an optimal solution. (b) If you try to adapt your proof from part (a) to prove that that u+v+w is an optimal solution, say exactly which part(s) of the proof go wrong. (c) If you try to adapt your proof from part (a) to prove that u+v-w is an optimal solution, say exactly which part(s) of the proof go wrong.arrow_forward
- (a) For the following linear programme, sketch the feasible region and the direction of the objective function. Use you sketch to find an optimal solution to the program. State the optimal solution and give the objective value for this solution. maximize +22 subject to 1 + 2x2 ≤ 4, 1 +3x2 ≤ 12, x1, x2 ≥0 (b) For the following linear programme, sketch the feasible region and the direction of the objective function. Explain, making reference to your sketch, why this linear programme is unbounded. maximize ₁+%2 subject to -2x1 + x2 ≤ 4, x1 - 2x2 ≤4, x1 + x2 ≥ 7, x1,x20 Give any feasible solution to the linear programme for which the objective value is 40 (you do not need to justify your answer).arrow_forwardfind the domain of the function f(x)arrow_forwardFor each of the following functions, find the Taylor Series about the indicated center and also determine the interval of convergence for the series. 1. f(x) = ex-2, c = 2 Π == 2. f(x) = sin(x), c = 2arrow_forward
 Algebra & Trigonometry with Analytic GeometryAlgebraISBN:9781133382119Author:SwokowskiPublisher:Cengage
 Algebra: Structure And Method, Book 1AlgebraISBN:9780395977224Author:Richard G. Brown, Mary P. Dolciani, Robert H. Sorgenfrey, William L. ColePublisher:McDougal Littell
 Glencoe Algebra 1, Student Edition, 9780079039897...AlgebraISBN:9780079039897Author:CarterPublisher:McGraw Hill
 Holt Mcdougal Larson Pre-algebra: Student Edition...AlgebraISBN:9780547587776Author:HOLT MCDOUGALPublisher:HOLT MCDOUGAL