Videos
a
To calculate: To find the number of butterflies after migration and after reproduction using the given values
a
Answer to Problem 37E
There are
Explanation of Solution
Given information: Each year, 20% of the butterflies from the first island fly to the second and 30% of the butterflies from the second fly to the first.
Calculation:
Suppose that two nearby islands have populations of butterflies, with
Consider the first island. In the beginning there are 100 butterflies out of which 20 migrate to the second island and 30 migrate from the second island to the first island.
Hence, there are
Now consider the second island- In the beginning there are 100 butterflies out of which 30 migrate to the first island and 20 migrate from the first island to the second island.
Hence, there are
Again consider the first island. Now there are 190 butterflies out of which 38 migrate to the second island and 33 migrate from the second island to the first island.
Hence, there are
Now consider the second island- In the beginning there are 110 butterflies out of which 33 migrate to the first island and 38 migrate from the first island to the second island.
Hence, there are
b
To calculate: To find the equations of
b
Answer to Problem 37E
The equation for
Explanation of Solution
Given information: Each year, 20% of the butterflies from the first island fly to the second and 30% of the butterflies from the second fly to the first.
Calculation:
Now the equation for
Also, the equation for
c
To calculate: To find the discrete-time dynamical system for
c
Answer to Problem 37E
Explanation of Solution
Given information: Each year, 20% of the butterflies from the first island fly to the second and 30% of the butterflies from the second fly to the first.
Calculation:
To find the discrete-time dynamical system for
d
To calculate: To find the equilibrium of
d
Answer to Problem 37E
Explanation of Solution
Given information: Each year, 20% of the butterflies from the first island fly to the second and 30% of the butterflies from the second fly to the first.
Calculation:
To find the equilibrium
Now using the
This is larger because the butterflies from the first island reproduce.
e
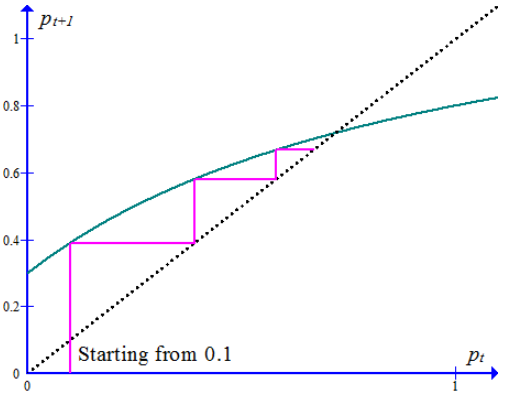
To calculate: To draw the graph using the obtained values
e
Answer to Problem 37E
Hence the graph is drawn using the obtained values.
Explanation of Solution
Given information: Each year, 20% of the butterflies from the first island fly to the second and 30% of the butterflies from the second fly to the first.
Calculation:
The graph and the cobweb are as follows:
Want to see more full solutions like this?
Chapter 1 Solutions
Modeling the Dynamics of Life: Calculus and Probability for Life Scientists


- Let Χ be a real-valued character (mod k). Let k S = Σnx(n). n=1 If (a, k) = 1, ax(a)S = S (mod k). (iii) Write k = 2ºq where q is odd. Show that there is an integer a with (a, k) = 1 such that a = 3 (mod 2ª) and a = 2 (mod q). Deduce that 12S = 0 (mod k).arrow_forwardProve that (1) Σσς (α) μ(η/α) = n d/n (ii) Σσς(d) = η Σσο(α)/d d❘n d❘n (iii) σ (d) σ (n/d) = Σ d³oo(d) σo(n/d). d|n dnarrow_forwardhow to do part b,carrow_forward
- If p = 5 (mod 8), where p is prime, show that p|2 (P-1)/2 + 1. State and prove the corresponding result when p = 7 (mod 8). Deduce that 250 + 1 and 251 1 are composite. -arrow_forwardWhy the character no change for my remark?arrow_forwardIn preparing for the upcoming holiday season, Fresh Toy Company (FTC) designed a new doll called The Dougie that teaches children how to dance. The fixed cost to produce the doll is $100,000. The variable cost, which includes material, labor, and shipping costs, is $31 per doll. During the holiday selling season, FTC will sell the dolls for $39 each. If FTC overproduces the dolls, the excess dolls will be sold in January through a distributor who has agreed to pay FTC $10 per doll. Demand for new toys during the holiday selling season is extremely uncertain. Forecasts are for expected sales of 60,000 dolls with a standard deviation of 15,000. The normal probability distribution is assumed to be a good description of the demand. FTC has tentatively decided to produce 60,000 units (the same as average demand), but it wants to conduct an analysis regarding this production quantity before finalizing the decision. (a) Determine the equation for computing FTC's profit for given values of the…arrow_forward
- To generate leads for new business, Gustin Investment Services offers free financial planning seminars at major hotels in Southwest Florida. Gustin conducts seminars for groups of 25 individuals. Each seminar costs Gustin $3,700, and the average first-year commission for each new account opened is $5,200. Gustin estimates that for each individual attending the seminar, there is a 0.01 probability that individual will open a new account. (a) Determine the equation for computing Gustin's profit per seminar, given values of the relevant parameters. Profit = (3,700 x 5,200) - New Accounts Opened Profit = 5,200 - (New Accounts Opened x 3,700) Profit = (New Accounts Opened x 3,700) - 5,200 Profit = New Accounts Opened - (5,200 × 3,700) Profit = (New Accounts Opened x 5,200) - 3,700 (b) What type of random variable is the number of new accounts opened? Hint: Review Appendix 12.1 for descriptions of various types of probability distributions. continuous integer uniform normal discrete uniform…arrow_forwardStrassel Investors buys real estate, develops it, and resells it for a profit. A new property is available, and Bud Strassel, the president and owner of Strassel Investors, believes if he purchases and develops this property, it can then be sold for $158,000. The current property owner has asked for bids and stated that the property will be sold for the highest bid in excess of $100,000. Two competitors will be submitting bids for the property. Strassel does not know what the competitors will bid, but he assumes for planning purposes that the amount bid by each competitor will be uniformly distributed between $100,000 and $148,000. (a) What is the estimate of the probability Strassel will be able to obtain the property using a bid of $128,000? (Use at least 5,000 trials. Round your answer three decimal places.) (b) How much does Strassel need to bid to be assured of obtaining the property? $128,000 $138,000 $148,000 (c) Use the simulation model to compute the profit for each trial of…arrow_forwardGrear Tire Company has produced a new tire with an estimated mean lifetime mileage of 34,500 miles. Management also believes that the standard deviation is 4,500 miles and that tire mileage is normally distributed. To promote the new tire, Grear has offered to refund a portion of the purchase price if the tire fails to reach 30,000 miles before the tire needs to be replaced. Specifically, for tires with a lifetime below 30,000 miles, Grear will refund a customer $1 per 100 miles short of 30,000. Construct a simulation model to answer the following questions. (Use at least 1,000 trials.) (a) For each tire sold, what is the average cost of the promotion (in $)? (Round your answer to two decimal places.) (b) What is the probability that Grear will refund more than $25 for a tire? (Round your answer to three decimal places.)arrow_forward
 Trigonometry (MindTap Course List)TrigonometryISBN:9781337278461Author:Ron LarsonPublisher:Cengage Learning
 Intermediate AlgebraAlgebraISBN:9781285195728Author:Jerome E. Kaufmann, Karen L. SchwittersPublisher:Cengage Learning
 Algebra for College StudentsAlgebraISBN:9781285195780Author:Jerome E. Kaufmann, Karen L. SchwittersPublisher:Cengage Learning
 Holt Mcdougal Larson Pre-algebra: Student Edition...AlgebraISBN:9780547587776Author:HOLT MCDOUGALPublisher:HOLT MCDOUGAL
 Glencoe Algebra 1, Student Edition, 9780079039897...AlgebraISBN:9780079039897Author:CarterPublisher:McGraw Hill