
Introduction To Statistics And Data Analysis
6th Edition
ISBN: 9781337793612
Author: PECK, Roxy.
Publisher: Cengage Learning,
expand_more
expand_more
format_list_bulleted
Concept explainers
Videos
Textbook Question
Chapter 13.2, Problem 28E
Consider the accompanying data on x = Research and development expenditure (thousands of dollars) and y = Growth rate (% per year) for eight different industries.
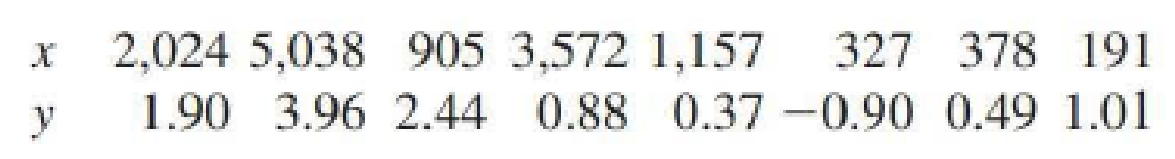
- a. Would a simple linear regression model provide useful information for predicting growth rate from research and development expenditure? Test the appropriate hypotheses using a 0.05 significance level.
- b. Use a 90% confidence
interval to estimate the average change in growth rate associated with a $1000 increase in expenditure. Interpret the resulting interval.
Expert Solution & Answer

Trending nowThis is a popular solution!

Students have asked these similar questions
2. An experiment is set up to test the effectiveness of a new drug for balancing
people's mood. The table below contains the results of the patients before and
after taking the drug. The possible scores are the integers from 0 to 10, where
0 indicates a depressed mood and 10 indicates and elated mood.
Patient Before
After
1
4
4
2
3
3
3
6
4
4
1
2
5
6
5
6
1
3
7
4
7
8
6
9
1
4
10
5
4
Assuming the differences of the observations to be symmetric, but not normally
distributed, investigate the effectiveness of the drug at the 5% significance level.
[4 Marks]
3. (i) Consider the following R code:
wilcox.test(UK Supermarkets $Salary ~ UKSupermarkets $Supermarket)
(a) Which test is being used in this code?
(b) What is the name of the dataset under consideration?
How would be adapt this code if we had ties? What other command
can be used which deals with ties?
(ii) Consider the following R code:
install packages("nortest")
library(nortest)
lillie.test (Differences)
(a) Assuming the appropriate dataset has been imported and attached,
what is wrong with this code?
(b) If this code were to be corrected, what would be determined by run-
ning it?
[3 Marks]
1. (i) Explain the difference in application between the Mann-Whitney U test
and the Wilcoxon Signed-Rank test, i.e. in which scenarios would each test be
used?
(ii) What is the main procedure underlying these nonparametric tests?
[3 Marks]
Chapter 13 Solutions
Introduction To Statistics And Data Analysis
Ch. 13.1 - Let x be the size of a house (in square feet) and...Ch. 13.1 - Consider the variables and population regression...Ch. 13.1 - The flow rate in a device used for air quality...Ch. 13.1 - The paper Predicting Yolk Height, Yolk Width,...Ch. 13.1 - A sample of small cars was selected, and the...Ch. 13.1 - Prob. 6ECh. 13.1 - Suppose that a simple linear regression model is...Ch. 13.1 - a. Explain the difference between the line y x...Ch. 13.1 - Prob. 9ECh. 13.1 - Hormone replacement therapy (HRT) is thought to...
Ch. 13.1 - Consider the data and estimated regression line...Ch. 13.1 - A simple linear regression model was used to...Ch. 13.1 - Consider the accompanying data on x = Advertising...Ch. 13.2 - What is the difference between and b? What is the...Ch. 13.2 - The largest commercial fishing enterprise in the...Ch. 13.2 - Prob. 16ECh. 13.2 - Prob. 17ECh. 13.2 - Prob. 18ECh. 13.2 - An experiment to study the relationship between x...Ch. 13.2 - The paper The Effects of Split Keyboard Geometry...Ch. 13.2 - The authors of the paper Decreased Brain Volume in...Ch. 13.2 - Do taller adults make more money? The authors of...Ch. 13.2 - Researchers studying pleasant touch sensations...Ch. 13.2 - Prob. 24ECh. 13.2 - Acrylamide is a chemical that is sometimes found...Ch. 13.2 - Prob. 26ECh. 13.2 - Exercise 13.18 described a regression analysis...Ch. 13.2 - Consider the accompanying data on x = Research and...Ch. 13.2 - Prob. 29ECh. 13.2 - In anthropological studies, an important...Ch. 13.3 - The graphs accompanying this exercise are based on...Ch. 13.3 - Prob. 32ECh. 13.3 - Prob. 33ECh. 13.3 - The article Vital Dimensions in Volume Perception:...Ch. 13.3 - Prob. 35ECh. 13.3 - An investigation of the relationship between x =...Ch. 13.4 - Prob. 37ECh. 13.4 - Prob. 38ECh. 13.4 - In Exercise 13.19, we considered a regression of y...Ch. 13.4 - Prob. 40ECh. 13.4 - A subset of data read from a graph that appeared...Ch. 13.4 - Prob. 42ECh. 13.4 - Prob. 43ECh. 13.4 - The article first introduced in Exercise 13.34 of...Ch. 13.4 - The shelf life of packaged food depends on many...Ch. 13.4 - For the cereal data of the previous exercise, the...Ch. 13.4 - The article Performance Test Conducted for a Gas...Ch. 13.5 - Prob. 48ECh. 13.5 - Prob. 49ECh. 13.5 - A sample of n = 353 college faculty members was...Ch. 13.5 - Prob. 51ECh. 13.5 - Prob. 52ECh. 13.5 - The accompanying summary quantities for x =...Ch. 13.5 - Prob. 54ECh. 13.5 - Prob. 55ECh. 13.6 - Prob. 56ECh. 13 - Prob. 1CRECh. 13 - Prob. 2CRECh. 13 - Prob. 3CRECh. 13 - Prob. 4CRECh. 13 - Prob. 5CRECh. 13 - The accompanying graphical display is similar to...Ch. 13 - Prob. 7CRECh. 13 - Prob. 8CRECh. 13 - Consider the following data on y = Number of songs...Ch. 13 - Many people take ginkgo supplements advertised to...Ch. 13 - Prob. 11CRECh. 13 - Prob. 12CRECh. 13 - Prob. 13CRECh. 13 - Prob. 14CRECh. 13 - The discharge of industrial wastewater into rivers...Ch. 13 - Many people take ginkgo supplements advertised to...Ch. 13 - It is hypothesized that when homing pigeons are...Ch. 13 - Prob. 18CRECh. 13 - Prob. 57CRCh. 13 - Prob. 58CRCh. 13 - Prob. 59CRCh. 13 - The article Photocharge Effects in Dye Sensitized...Ch. 13 - Prob. 61CRCh. 13 - Prob. 62CRCh. 13 - Prob. 63CRCh. 13 - Prob. 64CRCh. 13 - Prob. 65CRCh. 13 - The article Improving Fermentation Productivity...Ch. 13 - Prob. 67CRCh. 13 - Prob. 68CRCh. 13 - Prob. 69CR
Knowledge Booster


Learn more about
Need a deep-dive on the concept behind this application? Look no further. Learn more about this topic, statistics and related others by exploring similar questions and additional content below.Similar questions
- You may need to use the appropriate appendix table or technology to answer this question. You are given the following information obtained from a random sample of 4 observations. 24 48 31 57 You want to determine whether or not the mean of the population from which this sample was taken is significantly different from 49. (Assume the population is normally distributed.) (a) State the null and the alternative hypotheses. (Enter != for ≠ as needed.) H0: Ha: (b) Determine the test statistic. (Round your answer to three decimal places.) (c) Determine the p-value, and at the 5% level of significance, test to determine whether or not the mean of the population is significantly different from 49. Find the p-value. (Round your answer to four decimal places.) p-value = State your conclusion. Reject H0. There is insufficient evidence to conclude that the mean of the population is different from 49.Do not reject H0. There is sufficient evidence to conclude that the…arrow_forward65% of all violent felons in the prison system are repeat offenders. If 43 violent felons are randomly selected, find the probability that a. Exactly 28 of them are repeat offenders. b. At most 28 of them are repeat offenders. c. At least 28 of them are repeat offenders. d. Between 22 and 26 (including 22 and 26) of them are repeat offenders.arrow_forward08:34 ◄ Classroom 07:59 Probs. 5-32/33 D ا. 89 5-34. Determine the horizontal and vertical components of reaction at the pin A and the normal force at the smooth peg B on the member. A 0,4 m 0.4 m Prob. 5-34 F=600 N fr th ar 0. 163586 5-37. The wooden plank resting between the buildings deflects slightly when it supports the 50-kg boy. This deflection causes a triangular distribution of load at its ends. having maximum intensities of w, and wg. Determine w and wg. each measured in N/m. when the boy is standing 3 m from one end as shown. Neglect the mass of the plank. 0.45 m 3 marrow_forward
- Examine the Variables: Carefully review and note the names of all variables in the dataset. Examples of these variables include: Mileage (mpg) Number of Cylinders (cyl) Displacement (disp) Horsepower (hp) Research: Google to understand these variables. Statistical Analysis: Select mpg variable, and perform the following statistical tests. Once you are done with these tests using mpg variable, repeat the same with hp Mean Median First Quartile (Q1) Second Quartile (Q2) Third Quartile (Q3) Fourth Quartile (Q4) 10th Percentile 70th Percentile Skewness Kurtosis Document Your Results: In RStudio: Before running each statistical test, provide a heading in the format shown at the bottom. “# Mean of mileage – Your name’s command” In Microsoft Word: Once you've completed all tests, take a screenshot of your results in RStudio and paste it into a Microsoft Word document. Make sure that snapshots are very clear. You will need multiple snapshots. Also transfer these results to the…arrow_forwardExamine the Variables: Carefully review and note the names of all variables in the dataset. Examples of these variables include: Mileage (mpg) Number of Cylinders (cyl) Displacement (disp) Horsepower (hp) Research: Google to understand these variables. Statistical Analysis: Select mpg variable, and perform the following statistical tests. Once you are done with these tests using mpg variable, repeat the same with hp Mean Median First Quartile (Q1) Second Quartile (Q2) Third Quartile (Q3) Fourth Quartile (Q4) 10th Percentile 70th Percentile Skewness Kurtosis Document Your Results: In RStudio: Before running each statistical test, provide a heading in the format shown at the bottom. “# Mean of mileage – Your name’s command” In Microsoft Word: Once you've completed all tests, take a screenshot of your results in RStudio and paste it into a Microsoft Word document. Make sure that snapshots are very clear. You will need multiple snapshots. Also transfer these results to the…arrow_forwardExamine the Variables: Carefully review and note the names of all variables in the dataset. Examples of these variables include: Mileage (mpg) Number of Cylinders (cyl) Displacement (disp) Horsepower (hp) Research: Google to understand these variables. Statistical Analysis: Select mpg variable, and perform the following statistical tests. Once you are done with these tests using mpg variable, repeat the same with hp Mean Median First Quartile (Q1) Second Quartile (Q2) Third Quartile (Q3) Fourth Quartile (Q4) 10th Percentile 70th Percentile Skewness Kurtosis Document Your Results: In RStudio: Before running each statistical test, provide a heading in the format shown at the bottom. “# Mean of mileage – Your name’s command” In Microsoft Word: Once you've completed all tests, take a screenshot of your results in RStudio and paste it into a Microsoft Word document. Make sure that snapshots are very clear. You will need multiple snapshots. Also transfer these results to the…arrow_forward
- 2 (VaR and ES) Suppose X1 are independent. Prove that ~ Unif[-0.5, 0.5] and X2 VaRa (X1X2) < VaRa(X1) + VaRa (X2). ~ Unif[-0.5, 0.5]arrow_forward8 (Correlation and Diversification) Assume we have two stocks, A and B, show that a particular combination of the two stocks produce a risk-free portfolio when the correlation between the return of A and B is -1.arrow_forward9 (Portfolio allocation) Suppose R₁ and R2 are returns of 2 assets and with expected return and variance respectively r₁ and 72 and variance-covariance σ2, 0%½ and σ12. Find −∞ ≤ w ≤ ∞ such that the portfolio wR₁ + (1 - w) R₂ has the smallest risk.arrow_forward
- 7 (Multivariate random variable) Suppose X, €1, €2, €3 are IID N(0, 1) and Y2 Y₁ = 0.2 0.8X + €1, Y₂ = 0.3 +0.7X+ €2, Y3 = 0.2 + 0.9X + €3. = (In models like this, X is called the common factors of Y₁, Y₂, Y3.) Y = (Y1, Y2, Y3). (a) Find E(Y) and cov(Y). (b) What can you observe from cov(Y). Writearrow_forward1 (VaR and ES) Suppose X ~ f(x) with 1+x, if 0> x > −1 f(x) = 1−x if 1 x > 0 Find VaRo.05 (X) and ES0.05 (X).arrow_forwardJoy is making Christmas gifts. She has 6 1/12 feet of yarn and will need 4 1/4 to complete our project. How much yarn will she have left over compute this solution in two different ways arrow_forward
arrow_back_ios
SEE MORE QUESTIONS
arrow_forward_ios
Recommended textbooks for you
 Glencoe Algebra 1, Student Edition, 9780079039897...AlgebraISBN:9780079039897Author:CarterPublisher:McGraw Hill
 Functions and Change: A Modeling Approach to Coll...AlgebraISBN:9781337111348Author:Bruce Crauder, Benny Evans, Alan NoellPublisher:Cengage Learning
 College AlgebraAlgebraISBN:9781305115545Author:James Stewart, Lothar Redlin, Saleem WatsonPublisher:Cengage Learning
 Big Ideas Math A Bridge To Success Algebra 1: Stu...AlgebraISBN:9781680331141Author:HOUGHTON MIFFLIN HARCOURTPublisher:Houghton Mifflin Harcourt
 Algebra and Trigonometry (MindTap Course List)AlgebraISBN:9781305071742Author:James Stewart, Lothar Redlin, Saleem WatsonPublisher:Cengage Learning
Glencoe Algebra 1, Student Edition, 9780079039897...
Algebra
ISBN:9780079039897
Author:Carter
Publisher:McGraw Hill
Functions and Change: A Modeling Approach to Coll...
Algebra
ISBN:9781337111348
Author:Bruce Crauder, Benny Evans, Alan Noell
Publisher:Cengage Learning
College Algebra
Algebra
ISBN:9781305115545
Author:James Stewart, Lothar Redlin, Saleem Watson
Publisher:Cengage Learning
Big Ideas Math A Bridge To Success Algebra 1: Stu...
Algebra
ISBN:9781680331141
Author:HOUGHTON MIFFLIN HARCOURT
Publisher:Houghton Mifflin Harcourt
Algebra and Trigonometry (MindTap Course List)
Algebra
ISBN:9781305071742
Author:James Stewart, Lothar Redlin, Saleem Watson
Publisher:Cengage Learning
Correlation Vs Regression: Difference Between them with definition & Comparison Chart; Author: Key Differences;https://www.youtube.com/watch?v=Ou2QGSJVd0U;License: Standard YouTube License, CC-BY
Correlation and Regression: Concepts with Illustrative examples; Author: LEARN & APPLY : Lean and Six Sigma;https://www.youtube.com/watch?v=xTpHD5WLuoA;License: Standard YouTube License, CC-BY