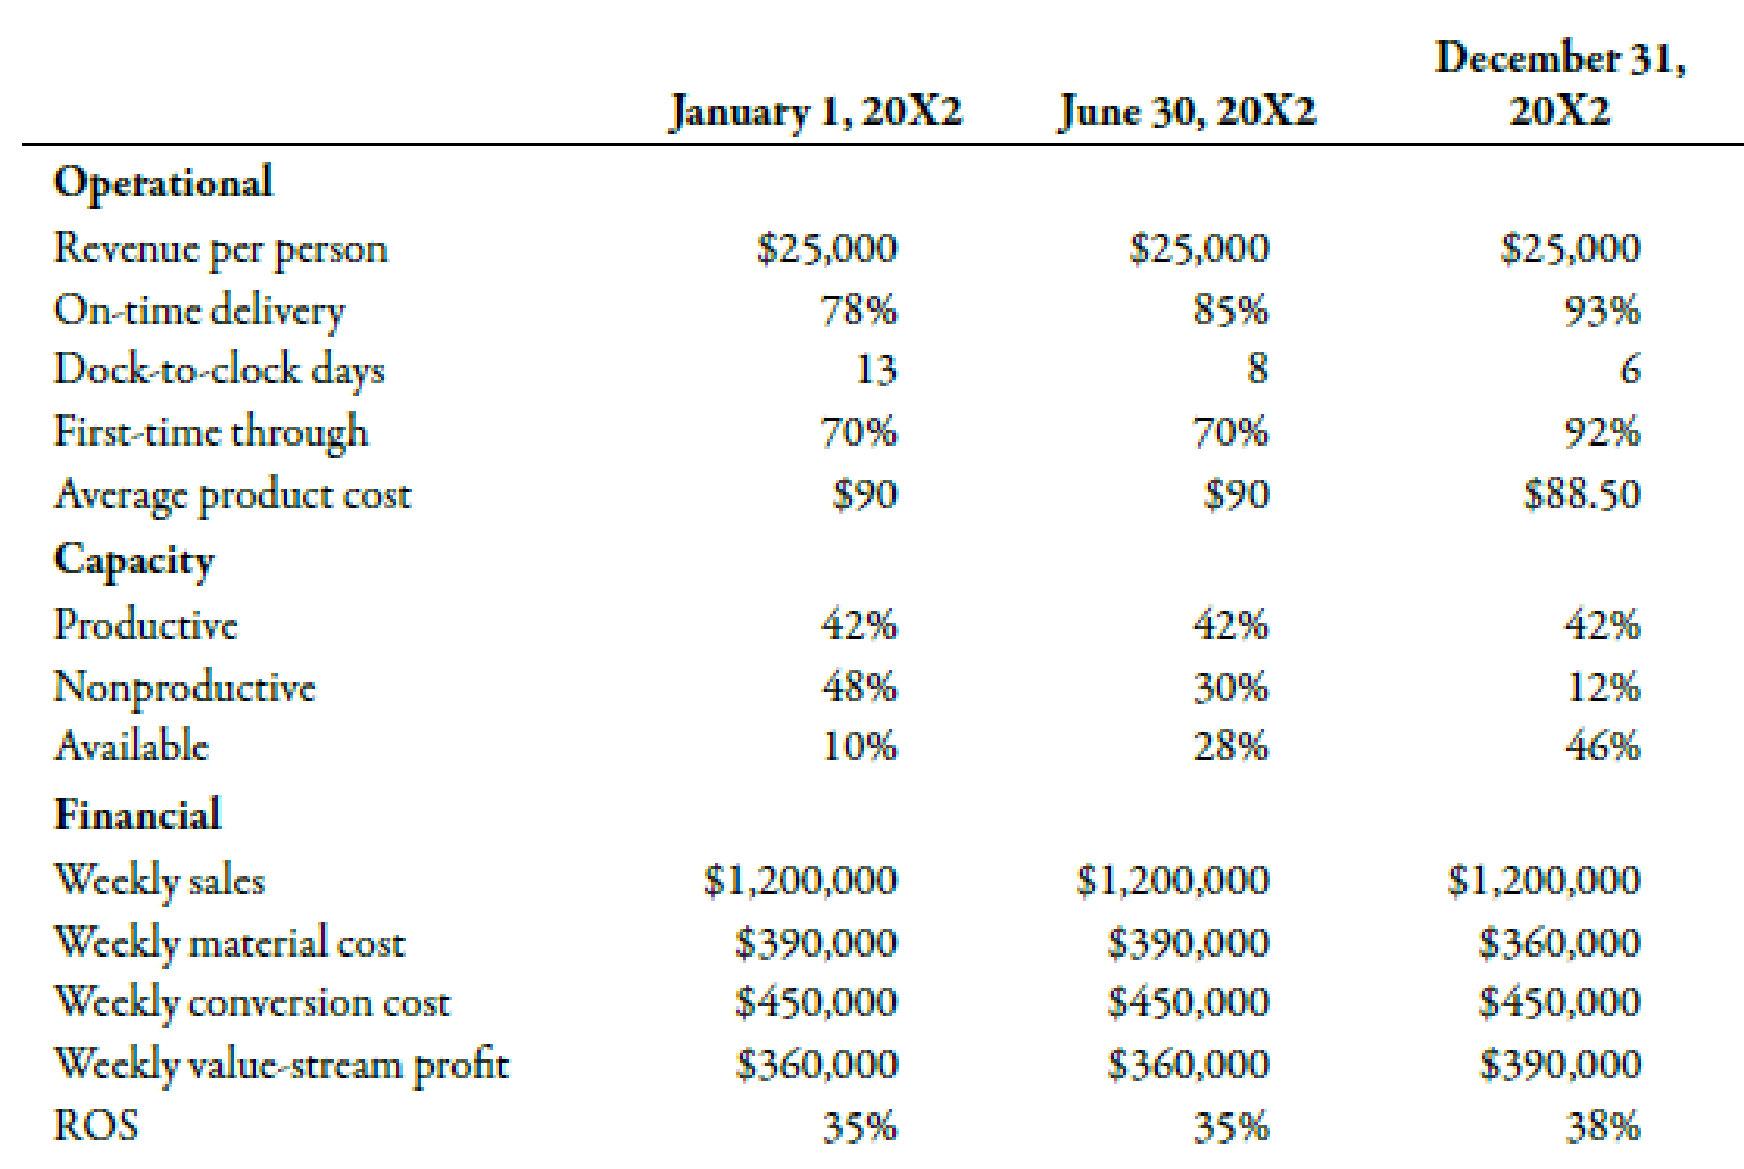
Merkley Company, a manufacturer of machine parts, implemented lean manufacturing at the end of 20X1. Three value streams were established: one for new product development and two order fulfillment value streams. One of the value streams set a goal to increase its ROS to 45% of sales by the end of the year. During the year, the value stream made significant improvements in several areas. The Box Scorecard below was prepared, with performance measures for the beginning of the year, midyear, and end of year. Although the members of the value stream were pleased with their progress, they were disappointed in the financial results. They were still far from the targeted ROS of 45%. They were also puzzled as to why the improvements made did not translate into significantly improved financial performance.

Required:
- 1. From the scorecard, what was the focus of the value-stream team for the first 6 months? The second 6 months? What are the implications of these changes?
- 2. Using information from the scorecard, offer an explanation for why the financial results were not as good as expected.
Want to see the full answer?
Check out a sample textbook solution
Chapter 13 Solutions
Managerial Accounting
- Bradford Company, a manufacturer of small tools, implemented lean manufacturing at the end of 20x1. The companys goal for the year was to increase the ROS to 40 percent of sales. A value-stream team was established and began to work on lean improvements. During the year, the team was able to achieve significant results on several fronts. The Box Scorecard below reflects the performance measures at the beginning of the year, midyear, and end of year. Although the team members were pleased with their progress, they were disappointed in the financial results. They were still far from the targeted ROS of 40 percent. They were also puzzled as to why the improvements made did not translate into significantly improved financial performance. Required: 1. From the scorecard, what was the focus of the value-stream team for the first six months? The second six months? What are the implications of these changes? 2. Using information from the scorecard, offer an explanation for why the financial results were not as good as expected. 3. Suppose that on December 31, 20x2, a potential customer offered to purchase an order of goods that would increase weekly revenues in January by 100,000 and material cost by 30,000. Using the old standard cost system, the projected conversion cost of the order would be 60,000. Would you recommend that the order be accepted or rejected? Explain.arrow_forwardAt the end of 20x1, Mejorar Company implemented a low-cost strategy to improve its competitive position. Its objective was to become the low-cost producer in its industry. A Balanced Scorecard was developed to guide the company toward this objective. To lower costs, Mejorar undertook a number of improvement activities such as JIT production, total quality management, and activity-based management. Now, after two years of operation, the president of Mejorar wants some assessment of the achievements. To help provide this assessment, the following information on one product has been gathered: Required: 1. Compute the following measures for 20x1 and 20x3: a. Actual velocity and cycle time b. Percentage of total revenue from new customers (assume one unit per customer) c. Percentage of very satisfied customers (assume each customer purchases one unit) d. Market share e. Percentage change in actual product cost (for 20x3 only) f. Percentage change in days of inventory (for 20x3 only) g. Defective units as a percentage of total units produced h. Total hours of training i. Suggestions per production worker j. Total revenue k. Number of new customers 2. For the measures listed in Requirement 1, list likely strategic objectives, classified according to the four Balance Scorecard perspectives. Assume there is one measure per objective.arrow_forwardThe controller of Emery, Inc. has computed quality costs as a percentage of sales for the past 5 years (20X1 was the first year the company implemented a quality improvement program). This information is as follows: Required: 1. Prepare a trend graph for total quality costs. Comment on what the graph has to say about the success of the quality improvement program. 2. Prepare a graph that shows the trend for each quality cost category. What does the graph have to say about the success of the quality improvement program? Does this graph supply more insight than the total cost trend graph does? 3. Prepare a graph that compares the trend in relative control costs versus relative failure costs. Comment on the significance of this trend.arrow_forward
- Pintura Company implemented a quality improvement program and tracked the following for the five years: By cost category as a percentage of sales for the same period of time: Required: 1. Prepare a bar graph that reveals the trend in quality cost as a percentage of sales (time on the horizontal axis and percentages on the vertical). Comment on the message of the graph. 2. Prepare a bar graph for each cost category as a percentage of sales. What does this graph tell you?arrow_forwardRoss Company implemented a quality improvement program and tracked the following for the five years: By cost category as a percentage of sales for the same period of time: Required: 1. Prepare a bar graph that reveals the trend in quality cost as a percentage of sales (time on the horizontal axis and percentages on the vertical). Comment on the message of the graph. 2. Prepare a bar graph for each cost category as a percentage of sales. What does this graph tell you? 3. What if management would like to have the trend in relative distribution of quality costs? Express this as a bar graph and comment on its significance.arrow_forwardNorris Company implemented a quality improvement program and tracked the following for the 5 years: By cost category of sales for the same period of time: Required: 1. Prepare a bar graph (hat reveals the trend in quality cost as a percentage of sales (time on horizontal axis and percentages on the vertical). Comment on the message of the graph. 2. Prepare a bar graph for each cost category as a percentage of sales. What does this graph tell you?arrow_forward
- At the end of Year 1, Cardigan Corporation implemented a new labor process and redesigned its product with the expectation that input usage efficiency would increase. Now, at the end of Year 2, the president of the company wants an assessment of the changes on the company's productivity. The data needed for the assessment are as follows: Year 1 Year 2 Output 20,000 24,000 Output prices $10 $10 Change in profits $22,200 Profit-linked measurements: Materials $7,200 Labor 10,500 Power (1,500) What is the price-recovery component? a. $6,000 b. $(6,000) c. $22,200 d. $16,200arrow_forwardThe Consumer Products Division of Goich Corporation had average operating assets of $425,000 and net operating income of $47,000 in May. The minimum required rate of return for performance evaluation purposes is 8%. What was the Consumer Products Division's minimum required return in May?arrow_forwardArmer Company is accumulating data to use in preparing its annual profit plan for the coming year. The cost behavior pattern of the maintenance costs must be determined. The accounting staff has suggested the use of linear regression to derive an equation for maintenance hours and costs. Data regarding the maintenance hours and costs for the last year and the results of the regression analysis follow: Maintenance Machine Month Cost Hours $ 4,200 Jan. 480 Feb. 3,000 320 Mar. 3,600 400 Apr. 2,820 300 May 4,350 500 June 2,960 310 July 3,030 320 Aug. 4,470 520 Sept. 4,260 490 Oct. 4,050 470 Nov. 3,300 350 Dec. 3,160 340 Sum $43, 200 4,800 $ 3,600 $ $ $ 684.65 Average 400 Average cost per hour a (intercept) b (coefficient) 9.00 7.2884 Standard error of the estimate 34.469 R-squared 0.99724 t-value for b 60.105 At 400 hours of activity, Armer management can be approximately two-thirds confident that the maintenance costs will be in the range ofarrow_forward
- Recognising that there would be fierce competition to regain lost markets, Management felt that there should be a renewed focus on the productivity and profitability of the operations. The productivity analysis would focus on the Manufacturing department, and the profitability would examine both products. To conduct this analysis, you have extracted the following information for the Manufacturing Department for the month of January: At the start of the month there were 1,000 units in stock, which were 20% complete with respect to conversion costs, and was valued at $ 16,000. During the month, 9,000 units were introduced to the production. At the end of the month there were 1,000 units in stock which were 40% complete with respect to conversion costs. All Materials are added at the start of the process. Costs incurred for the month were: Materials - $ 63,000; Conversion costs - $ 139,840. The Department uses a FIFO costing system. Further examination of the records showed the…arrow_forwardRecognising that there would be fierce competition to regain lost markets, Management felt that there should be a renewed focus on the productivity and profitability of the operations. The productivity analysis would focus on the Manufacturing department, and the profitability would examine both products. To conduct this analysis, you have extracted the following information for the Manufacturing Department for the month of January: At the start of the month there were 1,000 units in stock, which were 20% complete with respect to conversion costs, and was valued at $ 16,000. During the month, 9,000 units were introduced to the production. At the end of the month there were 1,000 units in stock which were 40% complete with respect to conversion costs. All Materials are added at the start of the process. Costs incurred for the month were: Materials - $ 63,000; Conversion costs - $ 139,840. The Department uses a FIFO costing system. Further examination of the records showed the…arrow_forwardGive me correct answer and explanation.sarrow_forward
 Managerial Accounting: The Cornerstone of Busines...AccountingISBN:9781337115773Author:Maryanne M. Mowen, Don R. Hansen, Dan L. HeitgerPublisher:Cengage Learning
 Cornerstones of Cost Management (Cornerstones Ser...AccountingISBN:9781305970663Author:Don R. Hansen, Maryanne M. MowenPublisher:Cengage Learning
 Essentials of Business Analytics (MindTap Course ...StatisticsISBN:9781305627734Author:Jeffrey D. Camm, James J. Cochran, Michael J. Fry, Jeffrey W. Ohlmann, David R. AndersonPublisher:Cengage Learning
 Managerial AccountingAccountingISBN:9781337912020Author:Carl Warren, Ph.d. Cma William B. TaylerPublisher:South-Western College Pub
 Financial And Managerial AccountingAccountingISBN:9781337902663Author:WARREN, Carl S.Publisher:Cengage Learning,
 Principles of Cost AccountingAccountingISBN:9781305087408Author:Edward J. Vanderbeck, Maria R. MitchellPublisher:Cengage Learning


