Videos
1.
Prepare quality cost report and pie chart.
1.
Explanation of Solution
Quality Cost:
Organizations are required to bear costs due to non-conformity of goods or services with the general specifications. These costs are termed as quality costs. Quality costs can be categorized into preventive costs, detective costs, internal failure costs and external failure costs.
Preparation of quality cost report:
| Particulars | Year 1 ($) | Year 2 ($) |
| Prevention costs: | ||
| Quality circles | 6,000 | 60,000 |
| Design reviews | 3,000 | 30,000 |
| Quality improvement projects | 3,000 | 150,000 |
| Total prevention costs (A) | 12,000 | 240,000 |
| Percentage (E) | 0.39% | 7.81% |
| Detection costs: | ||
| Packaging inspection | 480,000 | 450,000 |
| Product acceptance | 60,000 | 42,000 |
| Total detection costs (B) | 540,000 | 492,000 |
| Percentage (F) | 17.58% | 16.02% |
| Internal failure costs: | ||
| Scrap | 420,000 | 360,000 |
| Rework | 540,000 | 480,000 |
| Yield losses | 240,000 | 150,000 |
| Retesting | 300,000 | 240,000 |
| Total internal failure costs (C) | 1,500,000 | 1,230,000 |
| Percentage (G) | 48.83% | 40.04% |
| External failure costs: | ||
| Returned materials | 240,000 | 240,000 |
| Allowances | 180,000 | 210,000 |
| Warranty | 600,000 | 660,000 |
| Total external failure costs (D) | 1,020,000 | 1,110,000 |
| Percentage (H) | 33.20% | 36.13% |
| Total quality costs | 3,072,000 | 3,072,000 |
| Total percentage | 100% | 100% |
Table (1)
Pie chart for year 1:
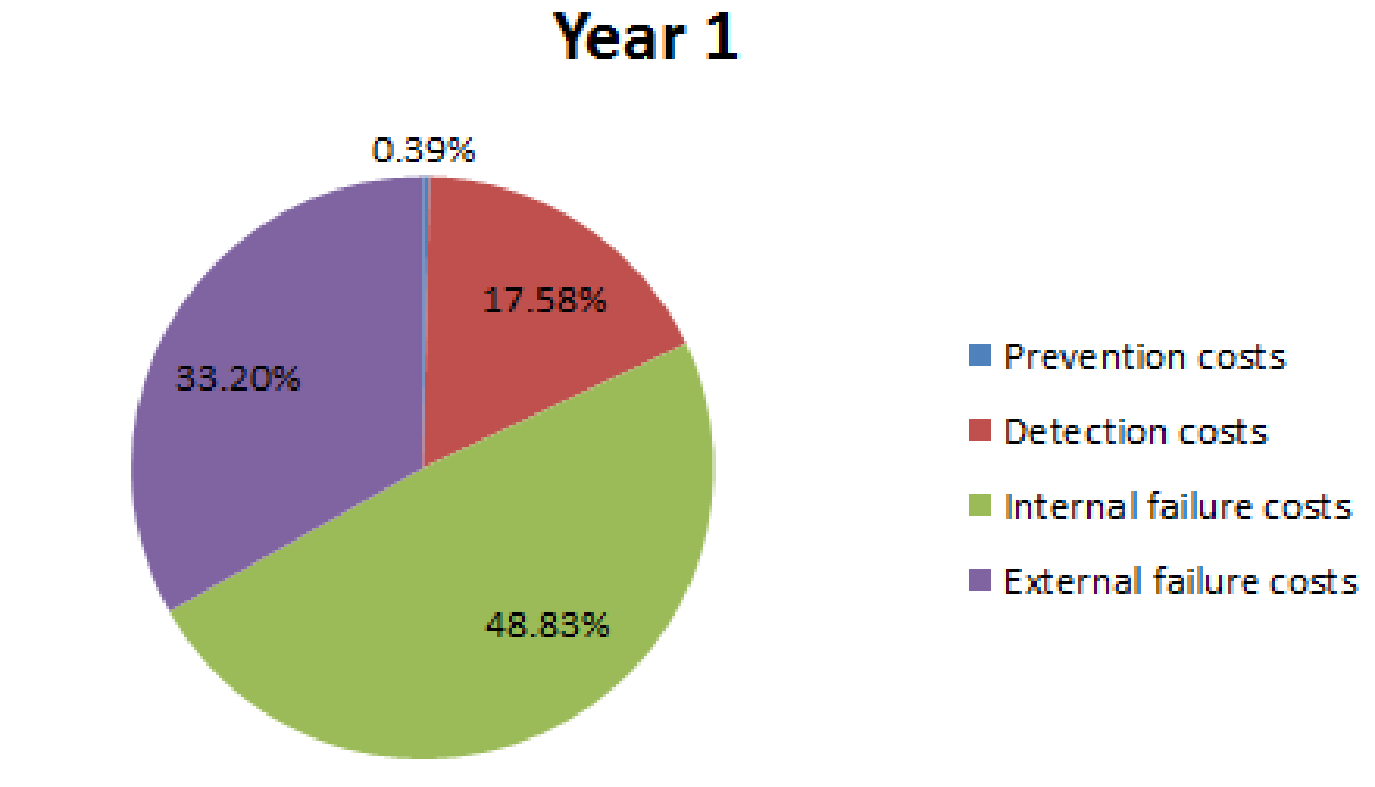
Fig (1)
Pie chart for year 2:
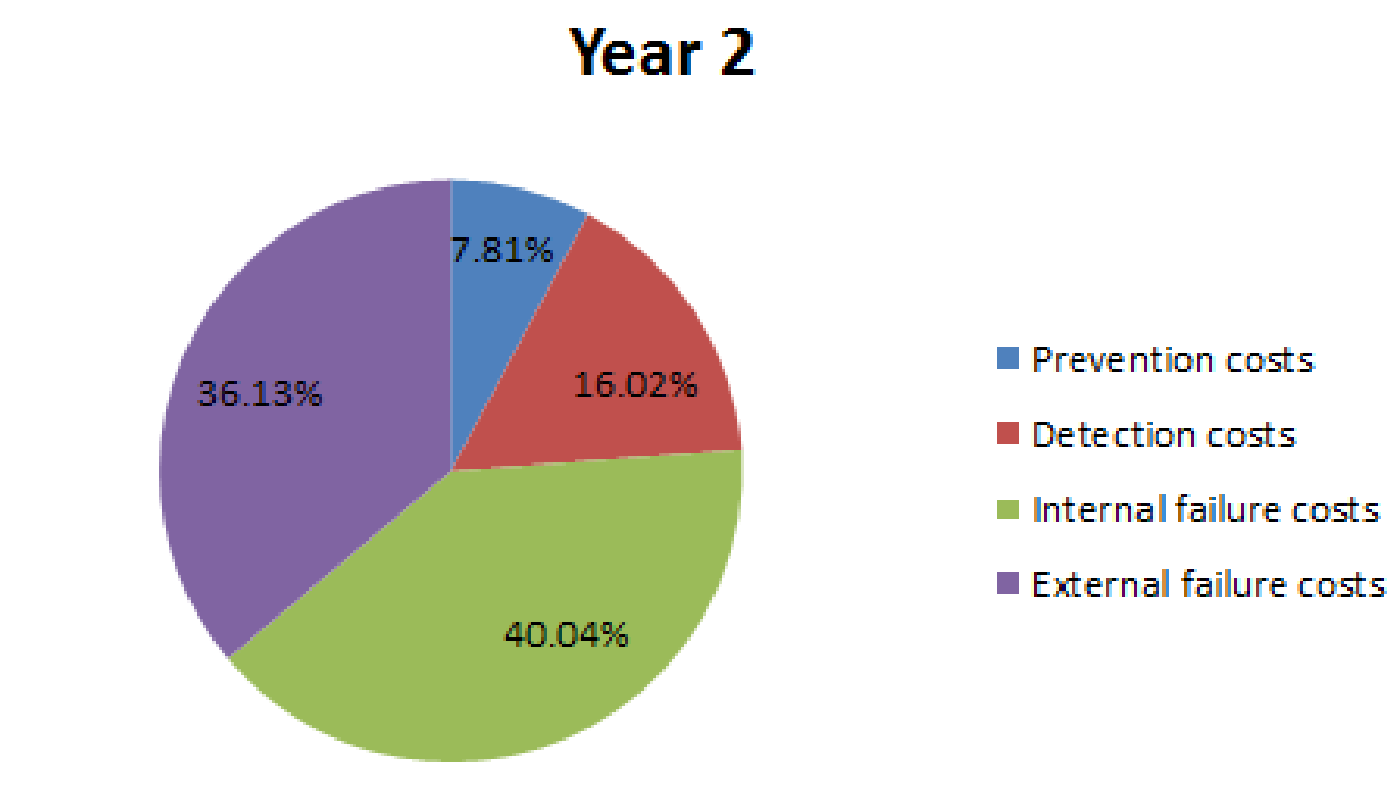
Fig (2)
Analysis of pie charts:
- The distribution pattern shown in the chart in year 1 is not appropriate.
- External failure costs and internal failure costs are much higher than their required levels.
- In comparison with year 1, year 2 is moving towards a right balance; since failure costs are reducing and prevention costs are increasing.
2.
Present a performance report for year 2 by comparing budgeted and actual figures of year 2. Also, compute the profits that have been increased due to quality improvements.
2.
Answer to Problem 55P
Increase in profit due to quality improvements is $768,000.
Explanation of Solution
Preparation of quality cost report:
| Particulars |
Year 1 ($) |
Year 2 Budgeted ($) (E) |
Year 2 Actual ($) (F) |
Variance ($) |
| Prevention costs: | ||||
| Quality circles | 6,000 | 7,500 | 60,000 | |
| Design reviews | 3,000 | 3,750 | 30,000 | |
| Quality improvement projects | 3,000 | 3,750 | 150,000 | |
| Total prevention costs (A) | 12,000 | 15,000 | 240,000 | |
| Detection costs: | ||||
| Packaging inspection | 480,000 | 600,000 | 450,000 | 150,000 |
| Product acceptance | 60,000 | 75,000 | 42,000 | 33,000 |
| Total detection costs (B) | 540,000 | 675,000 | 492,000 | 183,000 |
| Internal failure costs: | ||||
| Scrap | 420,000 | 525,000 | 360,000 | 165,000 |
| Rework | 540,000 | 675,000 | 480,000 | 195,000 |
| Yield losses | 240,000 | 300,000 | 150,000 | 150,000 |
| Retesting | 300,000 | 375,000 | 240,000 | 135,000 |
| Total internal failure costs (C) | 1,500,000 | 1,875,000 | 1,230,000 | 645,000 |
| External failure costs: | ||||
| Returned materials | 240,000 | 300,000 | 240,000 | 60,000 |
| Allowances | 180,000 | 225,000 | 210,000 | 15,000 |
| Warranty | 600,000 | 750,000 | 660,000 | 90,000 |
| Total external failure costs (D) | 1,020,000 | 1,275,000 | 1,110,000 | 165,000 |
|
Total quality costs | 3,072,000 | 3,840,000 | 3,072,000 | 768,000 |
Table (2)
Year 2 budgeted figures are computed by dividing the costs of year 1 by sales of year 1 $12,000,000 and multiplying by sales of year 2, $15,000,000.
Increase in profit due to quality improvements is $768,000.
3.
Compute increase in profits in case quality costs are reduced to 3% of sales revenue.
3.
Explanation of Solution
Computation of increase in profit:
| Particulars | Amount ($) |
| Existing total quality costs (A) | 3,072,000 |
| Sales | 15,000,000 |
|
Revised total quality costs (B) | 450,000 |
| Increase in profit | 2,622,000 |
Table (3)
Want to see more full solutions like this?
Chapter 13 Solutions
Managerial Accounting


- Below is information from the budget of the Jupiter manufacturing at the beginning of the current year:arrow_forwardThe equity of Nil Corporation is $245,600 and the total liabilities are $32,400. The total assets are _. Need Answerarrow_forwardCan you solve this general accounting question with accurate accounting calculations?arrow_forward
- Can you show me the correct approach to solve this financial accounting problem using suitable standards?arrow_forwardPavillion Corporation plans to generate $850,000 of sales revenue if a capital project is implemented. Assuming a 30% tax rate, the sales revenue should be reflected in the analysis by: a. $255,000 inflow b. $255,000 outflow c. $595,000 inflow d. $595,000 outflowarrow_forwardgeneral accountingarrow_forward
 Managerial Accounting: The Cornerstone of Busines...AccountingISBN:9781337115773Author:Maryanne M. Mowen, Don R. Hansen, Dan L. HeitgerPublisher:Cengage Learning
 Cornerstones of Cost Management (Cornerstones Ser...AccountingISBN:9781305970663Author:Don R. Hansen, Maryanne M. MowenPublisher:Cengage Learning