Concept explainers
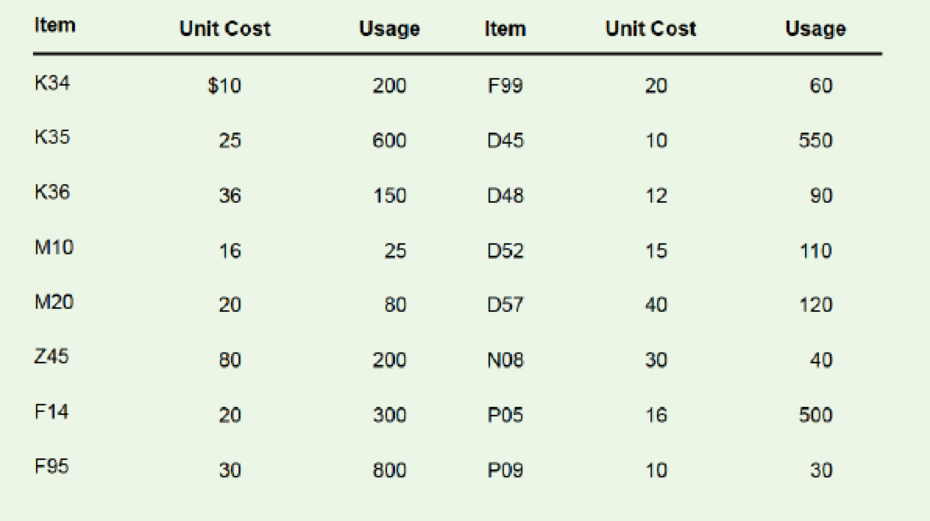
a. The following table contains figures on the monthly volume and unit costs for a random sample of 16 items from a list of 2,000 inventory items at a health care facility. Develop an A-B-C classification for these items.

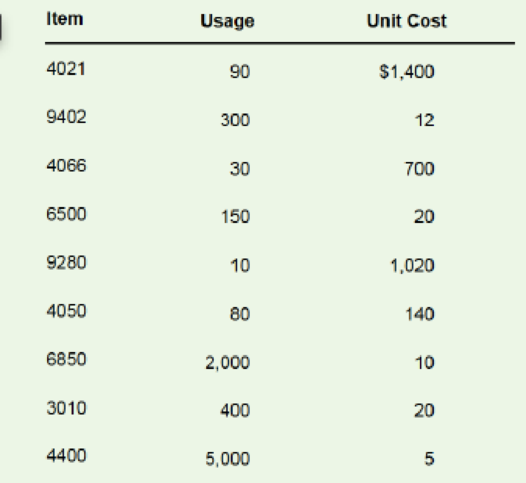
b. Given the monthly usages in the following table, classify the items in A, B, and C categories according to dollar usage.

C. Determine the percentage of items in each category and the annual dollar value for each category for pan b.
a)
To determine: ABC classification for the items.
Introduction: Inventory is a stock or store of goods. Every company store lots of goods as inventory which will be used during replenishment periods. Management of inventory is so much essential to manage cost and also to reduce cost.
Answer to Problem 2P
Explanation of Solution
Given information:
| Item | Unit Cost | Usage |
| K34 | $10 | 200 |
| K35 | 25 | 600 |
| K36 | 36 | 150 |
| M10 | 16 | 25 |
| M20 | 20 | 80 |
| Z45 | 80 | 200 |
| F14 | 20 | 300 |
| F95 | 30 | 800 |
| F99 | 20 | 60 |
| D45 | 10 | 550 |
| D48 | 12 | 90 |
| D52 | 15 | 110 |
| D57 | 40 | 120 |
| N08 | 30 | 40 |
| P05 | 16 | 500 |
| P09 | 10 | 30 |
Calculation for ABC classification:
Step 1: Calculation of annual dollar value
| Item | Unit Cost | Usage | Annual dollar value |
| K34 | $10 | 200 | $2,000 |
| K35 | 25 | 600 | $15,000 |
| K36 | 36 | 150 | $5,400 |
| M10 | 16 | 25 | $400 |
| M20 | 20 | 80 | $1,600 |
| Z45 | 80 | 200 | $16,000 |
| F14 | 20 | 300 | $6,000 |
| F95 | 30 | 800 | $24,000 |
| F99 | 20 | 60 | $1,200 |
| D45 | 10 | 550 | $5,500 |
| D48 | 12 | 90 | $1,080 |
| D52 | 15 | 110 | $1,650 |
| D57 | 40 | 120 | $4,800 |
| N08 | 30 | 40 | $1,200 |
| P05 | 16 | 500 | $8,000 |
| P09 | 10 | 30 | $300 |
| Total | $94,130 |
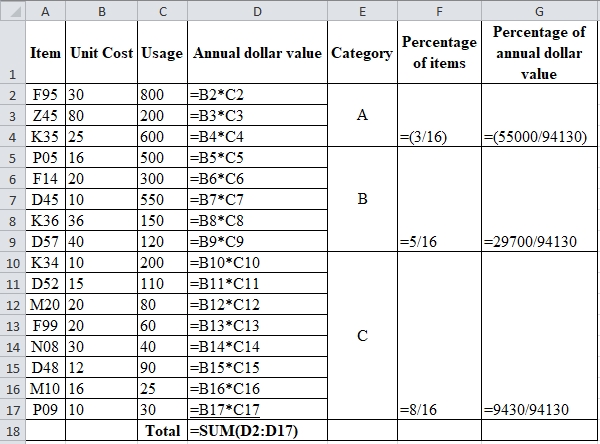
The annual dollar value is the product of unit cost and annual volume. For K34, the product of $10 and 200 gives $2,000 which is the dollar value for K34 and same procedure is followed for others items and the sum accounts to $94,130.
Step 2: Classification of items
| Item | Unit Cost | Usage | Annual dollar value | Category | Percentage of items | Percentage of annual dollar value |
| F95 | 30 | 800 | $24,000 | A | 18.75% | 58.43% |
| Z45 | 80 | 200 | $16,000 | |||
| K35 | 25 | 600 | $15,000 | |||
| P05 | 16 | 500 | $8,000 | B | 31.25% | 31.55% |
| F14 | 20 | 300 | $6,000 | |||
| D45 | 10 | 550 | $5,500 | |||
| K36 | 36 | 150 | $5,400 | |||
| D57 | 40 | 120 | $4,800 | |||
| K34 | $10 | 200 | $2,000 | C | 50.00% | 10.02% |
| D52 | 15 | 110 | $1,650 | |||
| M20 | 20 | 80 | $1,600 | |||
| F99 | 20 | 60 | $1,200 | |||
| N08 | 30 | 40 | $1,200 | |||
| D48 | 12 | 90 | $1,080 | |||
| M10 | 16 | 25 | $400 | |||
| P09 | 10 | 30 | $300 | |||
| Total | $94,130 |
Table 1
Excel Worksheet:

The items are classified based on their percentage of dollar value where 10-15% are classified as A items and 50% are classified as B items and lowest value are classified as C item which is shown in table 1.
Hence, ABC classification of items is shown in table 1.
b)
To determine:ABC classification for the items.
Introduction: Inventory is a stock or store of goods. Every company store lots of goods as inventory which will be used during replenishment periods. Management of inventory is so much essential to manage cost and also to reduce cost.
Answer to Problem 2P
Explanation of Solution
| Item | Usage | Unit Cost |
| 4021 | 90 | $1,400 |
| 9402 | 300 | 12 |
| 4066 | 30 | 700 |
| 6500 | 150 | 20 |
| 9280 | 10 | 1,020 |
| 4050 | 80 | 140 |
| 6850 | 2,000 | 10 |
| 3010 | 400 | 20 |
| 4400 | 5,000 | 5 |
Given information:
Calculation for ABC classification:
Step 1: Calculation of annual dollar value
| Item | Usage | Unit Cost | Annual dollar value |
| 4021 | 90 | $1,400 | $126,000 |
| 9402 | 300 | 12 | $3,600 |
| 4066 | 30 | 700 | $21,000 |
| 6500 | 150 | 20 | $3,000 |
| 9280 | 10 | 1,020 | $10,200 |
| 4050 | 80 | 140 | $11,200 |
| 6850 | 2,000 | 10 | $20,000 |
| 3010 | 400 | 20 | $8,000 |
| 4400 | 5,000 | 5 | $25,000 |
| Total | $228,000 |
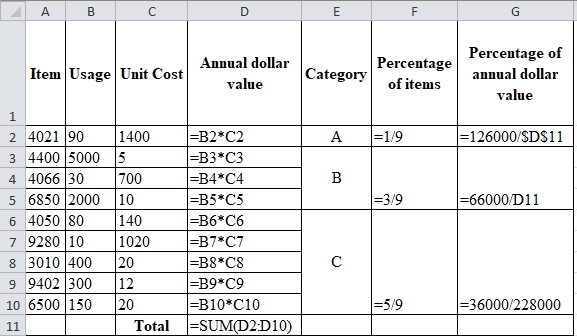
The annual dollar value is the product of unit cost and annual volume. For item 4021, the product of 90 and $1400 gives $126,000 which is the dollar value for item 4021 and same procedure is followed for others items and the sum accounts to $228,000.
Step 2: Classification of items:
| Item | Usage | Unit Cost | Annual dollar value | Category | Percentage of items | Percentage of annual dollar value |
| 4021 | 90 | $1,400 | $126,000 | A | 11.11% | 55.26% |
| 4400 | 5,000 | 5 | $25,000 | B | 33.33% | 28.95% |
| 4066 | 30 | 700 | $21,000 | |||
| 6850 | 2,000 | 10 | $20,000 | |||
| 4050 | 80 | 140 | $11,200 | C | 55.56% | 15.79% |
| 9280 | 10 | 1,020 | $10,200 | |||
| 3010 | 400 | 20 | $8,000 | |||
| 9402 | 300 | 12 | $3,600 | |||
| 6500 | 150 | 20 | $3,000 | |||
| Total | $228,000 |
Table 2
Excel Worksheet:

The items are classified based on their percentage of dollar value where 10-15% are classified as A items and 50% are classified as B items and lowest value are classified as C item which is shown in table 2.
Hence, ABC classification of items is shown in table 2.
c)
To determine: The percentage of items in each category and their respective annual dollar value.
Introduction: Inventory is a stock or store of goods. Every company store lots of goods as inventory which will be used during replenishment periods. Management of inventory is so much essential to manage cost and also to reduce cost.
Answer to Problem 2P
Explanation of Solution
Given information:
| Item | Unit Cost | Usage |
| K34 | $10 | 200 |
| K35 | 25 | 600 |
| K36 | 36 | 150 |
| M10 | 16 | 25 |
| M20 | 20 | 80 |
| Z45 | 80 | 200 |
| F14 | 20 | 300 |
| F95 | 30 | 800 |
| F99 | 20 | 60 |
| D45 | 10 | 550 |
| D48 | 12 | 90 |
| D52 | 15 | 110 |
| D57 | 40 | 120 |
| N08 | 30 | 40 |
| P05 | 16 | 500 |
| P09 | 10 | 30 |
Percentage of items in each category and their respective annual dollar value:
The percentage of items in each category and their respective annual dollar values are computed and shown in the classification table which is table 2.
Hence, the percentage of items in each category and their respective annual dollar value is shown in table 2,
Want to see more full solutions like this?
Chapter 13 Solutions
Operations Management
- Prepare a report on the following: Part 1: Discuss the role of the corporate secretary in facilitating effective governance in a limited liability company. Include the relationships with directors, shareholders, and other officers. Part 2: Compare and contrast two characteristics of different business entities (sole trader, partnership, and limited liability company). Use examples to recommend the most appropriate type of business entity for the scenario below: Scenario Background Alex, Taylor, and Jordan plan to collaborate to launch a tech startup focused on developing and selling innovative software solutions. Each individual brings unique skills and resources to the venture: Alex: A skilled software developer with technical expertise and a vision for the product. Taylor: A marketing professional with extensive connections in the technology industry, aiming to drive sales and build the brand. Jordan: An investor willing to contribute significant financial resources but…arrow_forwardProblem 1 (20 Points) Davison Electronics manufactures three LED television monitors, identified as Model A, Model B, and Model C. Davison Electronics four manufacturing plants. Each model has its lowest possible production cost when produced at Plant 1. However, Plant 1 does not have the capacity to handle the total production of all three models. As a result, at least some of the production must be routed to the other manufacturing plants. The following table shows the minimum production requirements for next month, the plant capacities in units per month, and the production cost per unit at each plant: Model Production Cost per Unit Minimum Production Requirements Plant 1 Plant 2 Plant 3 Plant 4 A $25 $28 $37 $34 48,000 B $26 $35 $36 $41 75,000 C $20 $31 $26 $23 60,000 Production Capacity 65,000 50,000 32,000 43,000 Davison’s objective is to determine the cost-minimizing production plan. Without…arrow_forwardSECTION B: TOPIC STRUCTURE CAPSTONE PROJECT TOPIC SUBMISSION TEMPLATE SECTION A: STUDENT DETAILS Student number Title (Mr/Miss/Ms/Mrs) Surname First name/s Title of research Date and year of registration Work Home Contact details Cell Region Date submitted Email 1.1 Title Insert title of the research. Choose a title that captures the essence of your proposed project. 1.2 Background to the Problem This section will be used to create the readers' interest. It can include a specific description of the topic that is to be investigated. A brief preview of the topic and the foundation of the problem should also be given. The researcher can achieve this through building up a detailed background of circumstances that lead to the problem being examined. Therefore, the background helps the reader understand the specific problem addressed by the researcher. This section should not include the background/history of the organisation. The background to the problem should not be more than ½ a page.…arrow_forward
- Does Nike Corporation's emphasis on lean operations help the Vietnamese workforce that still earns $150.00 minimum wage a month since 2014?arrow_forwardInformation Security Innovation within a Contemporary Business Environment All organisations using computers need to consider the security of information they keep. Many organisations utilise Websites for their core business functions and this results in monetary transactions being carried out on the Websites.arrow_forwardPlease help with a complete research report on the topic below: "Information Security Innovation within a Contemporary Business Environment " The format of the report should follow this below.arrow_forward
- 7. Wireless Infrastructure in the Cloud Wireless devices have changed the way organisations and their customers interact. Wireless enabled devices have driven the mindset that wireless networks must be ubiquitous, fast, and constantly available. These are demands that have traditionally put organisations and their user communities in direct conflict with their IT departments, as constructing and maintaining wireless infrastructures are typically time-consuming, complex, and costly endeavours.arrow_forwardIM.54 A growing online retailer sells thousands of items yet has has one specialty product category with just 30 items. They want to classify these thirty items according to the annual dollar volume (revenue) generated by each item. The table below lists each item number, Annual Sales (in units), and Price per unit: Item # Annual Sales Price 1 221 $25.85 2 446 $14.15 3 8,940 $168.19 4 2,965 $15.99 5 1,322 $29.37 6 2,575 $12.77 7 767 $28.43 8 5,803 $163.01 9 2,673 $20.51 10 642 $14.71 11 4,168 $54.53 12 1,881 $22.55 13 2,417 $29.63 14 5,207 $36.41 15 1,381 $20.55 16 9,635 $173.69 17 17,406 $27.07 18 1,573 $25.99 19 6,471 $64.99 20 6,047 $29.83 21 433 $20.89 22 2,279 $53.59 23 15,532 $106.91 24 1,585 $4.09 25 5,376 $65.23 26 2,965 $37.93 27 2,048 $28.51 28 1,174 $22.99 29 381 $5.57 30 2,930 $3.43 Which item in the table above has the highest annual dollar volume? In the answer field below, write the ITEM # that…arrow_forwardIM.84 An outdoor equipment manufacturer sells a rugged water bottle to complement its product line. They sell this item to a variety of sporting goods stores and other retailers. The manufacturer offers quantity discounts per the following discount schedule: Option Plan Quantity Price A 1 - 2,199 $5.00 B 2,200 - 3,699 $4.55 C 3,700+ $3.90 A large big-box retailer expects to sell 9,200 units this year. This retailer estimates that it incurs an internal administrative cost of $235 each time it places an order with the manufacturer. Holding cost for the retailer is $60 per case per year. (There are 52 units or water bottles per case.)Based on this information, and not taking into account any quantity discount offers, what is the calculated EOQ (in units)? (Display your answer to the nearest whole number.) Based on this information, sort each quantity discount plan from left to right by dragging the MOST preferred option plan to the left, and the LEAST preferred option…arrow_forward
- Please provide detailed solutions to the following problems/exercises (4 problems/exercises x 9 points each): 1) View the video ON Unveils ‘Lightspray’ Technology (4.55 mins, Ctrl+Click in the link), and The Secret of Lightspray (8.27 mins, Ctrl+Click in the link), answer the following questions: https://www.youtube.com/watch?v=wjmeaC-wlZs a) What is new about the design of ON’s shoes? b) How will ON’s new manufacturing technique affect location planning for footwear firms? c) How does ON focus on it sustainability strategy? Note: As a rough guideline, please try to keep the written submission to one or two paragraphs for each of the questions. 2) Unimed Hospital currently processes patient admissions through three admitting clerks who are set up to work in series, with respective reliabilities of 0.96, 0.95, and 0.90 (see figure below). a) Find the reliability of the current admission process. Due to rising patient complaints, the hospital administrator, Chimeg…arrow_forward3) A startup firm, Pocket International, has come up with a tiny programmable computer, NerdCom Mini Air, that sells for $49.99. The firm estimates that the programmable computers have an expected life that is exponential, with a mean of 24 months. The firm wants to estimate the probability that the NerdCom Mini Air will have a life that ends: a) after the initial 24 months of service. b) before the 24 months of service is completed. c) not before 48 months of service. Note: You could work out the problem by hand or use excel; in chapter 4S, section 4S.2 of the Stevenson text, reliability (finding the probability of functioning for a specified length of time) is covered with examples; chapters 4 & 4S Stevenson lecture power point slides 33 to 38 (chapters 4 & 4S lecture: 32.30 mins to 38.56 mins) cover reliability over time with examples.arrow_forwardDiscuss how training and development programs can be best presented to ultimately change the behavior of employees, often without their knowledge or awareness.arrow_forward
 Purchasing and Supply Chain ManagementOperations ManagementISBN:9781285869681Author:Robert M. Monczka, Robert B. Handfield, Larry C. Giunipero, James L. PattersonPublisher:Cengage LearningMarketingMarketingISBN:9780357033791Author:Pride, William MPublisher:South Western Educational Publishing
 Contemporary MarketingMarketingISBN:9780357033777Author:Louis E. Boone, David L. KurtzPublisher:Cengage Learning
 Practical Management ScienceOperations ManagementISBN:9781337406659Author:WINSTON, Wayne L.Publisher:Cengage,


