Concept explainers
Videos
(a)
To find: The graph for the corresponding functions by the use of standard viewing window. Also, determine if the graph reveal whether it is possible to reach the limit.
(a)
Answer to Problem 67E
The graph for the function is defined by the use of decimal setting and what the graph reveal and if it reach the limit is described.
Explanation of Solution
Given:
The given limit are,
Also,
Calculation
Consider the function
Press Y= and key in the function as shown in Figure 1
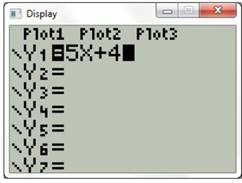
Figure 1
Press the graph button to trace the function as shown in Figure 2
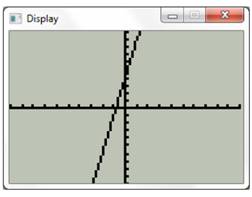
Figure 2
The graph of the function is defined at the required point the limit of the function exists at the defined point.
Consider the function
Press Y= and key in the function as shown in Figure 3
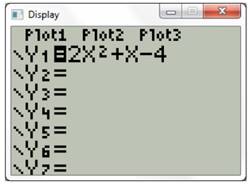
Figure 3
Press the graph button to trace the function as shown in Figure 4
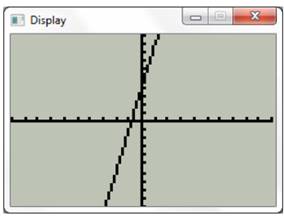
Figure 4
Consider the function
Press Y= and key in the function as shown in Figure 5

Figure 5
Press the graph button to trace the function as shown in Figure 6
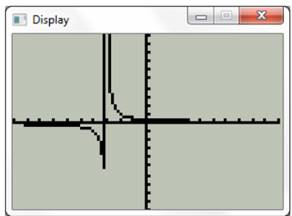
Figure 6
The graph of the function is defined at the required point the limit of the function exists at the defined point.
Consider the function
Press Y= and key in the function as shown in Figure 7
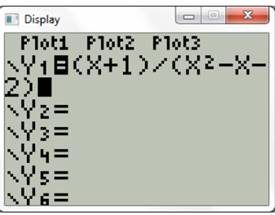
Figure 7
Press the graph button to trace the function as shown in Figure 8
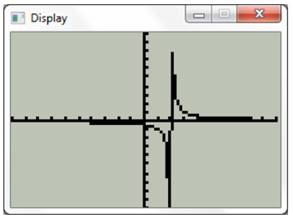
Figure 8
The graph of the function is defined at the required point the limit of the function exists at the defined point.
Consider the function
Press Y= and key in the function as shown in Figure 9

Figure 9
Press the graph button to trace the function as shown in Figure 10
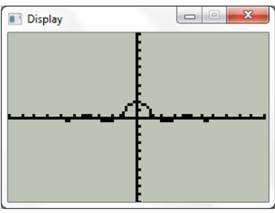
Figure 10
The graph of the function is defined at the required point the limit of the function exists at the defined point.
Consider the function
Press Y= and key in the function as shown in Figure 11
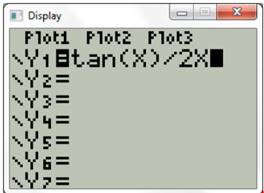
Figure 11
Press the graph button to trace the function as shown in Figure 12
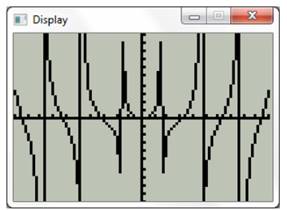
Figure 12
The graph of the function is defined at the required point the limit of the function exists at the defined point.
(b)
To find: The graph for the corresponding functions by the use of decimal settings window. Also, determine if the graph reveal whether it is possible to reach the limit.
(b)
Answer to Problem 67E
The graph for the function is defined by the use of decimal setting and what the graph reveal and if it reach the limit is described.
Explanation of Solution
Given:
The given limits are,
Also,
Calculation
In order to change the window setting to decimal setting of the individual graphs proceed as follows.
Consider the function
Press Y= and key in the function as shown in Figure 13

Figure 13
Press the windows to change the settings to decimal settings as shown in Figure 14
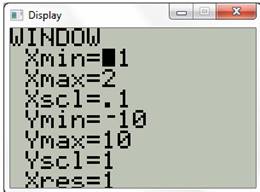
Figure
14
Press the graph button to trace the function as shown in Figure 15
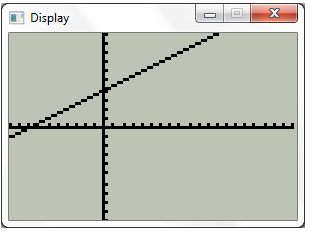
Figure 15
The graph of the function is defined at the required point the limit of the function exists at the defined point.
Consider the function
Press Y= and key in the function as shown in Figure 3
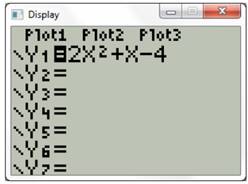
Figure 16
Press the windows to change the settings to decimal settings as shown in Figure 17
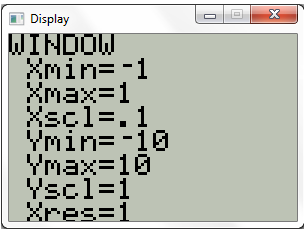
Figure 17
Press the graph button to trace the function as shown in Figure 18
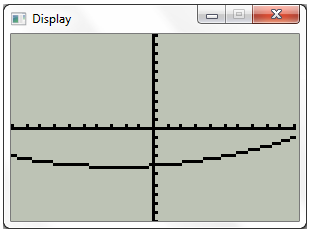
Figure 18
The graph of the function is defined at the required point the limit of the function exists at the defined point.
Consider the function
Press Y= and key in the function as shown in Figure 19
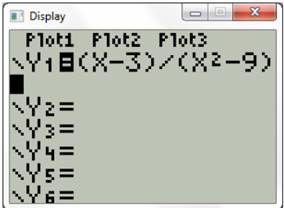
Figure 19
Press the windows to change the settings to decimal settings as shown in Figure 20
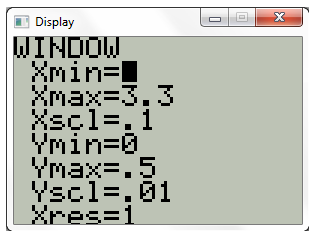
Figure 20
Press the graph button to trace the function as shown in Figure 21
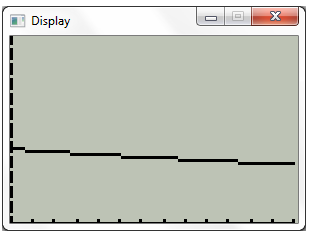
Figure 21
The graph of the function is defined at the required point the limit of the function exists at the defined point.
Consider the function
Press Y= and key in the function as shown in Figure 22

Figure 22
Press the windows to change the settings to decimal settings as shown in Figure 23
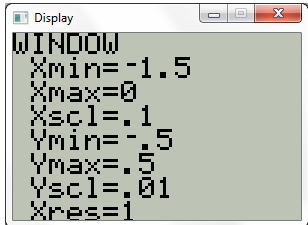
Figure 23
Press the graph button to trace the function as shown in Figure 24
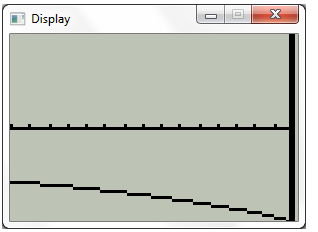
Figure 24
The graph of the function is defined at the required point the limit of the function exists at the defined point.
Consider the function
Press Y= and key in the function as shown in Figure 25
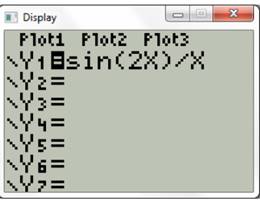
Figure 25
Press the windows to change the settings to decimal settings as shown in Figure 26
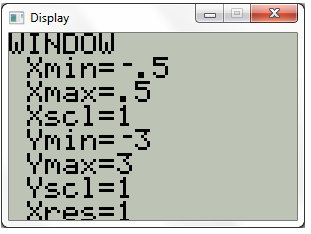
Figure 26
Press the graph button to trace the function as shown in Figure 27
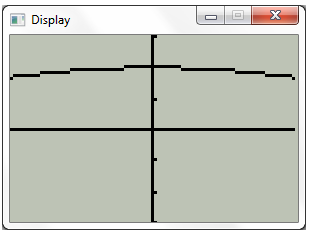
Figure 27
The graph of the function is defined at the required point the limit of the function exists at the defined point.
Consider the function
Press Y= and key in the function as shown in Figure 28

Figure 28
Press the windows to change the settings to decimal settings as shown in Figure 29
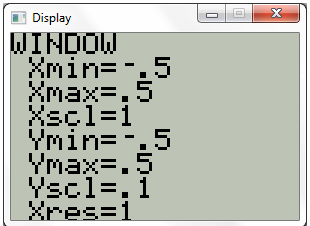
Figure 29
Press the graph button to trace the function as shown in Figure 30
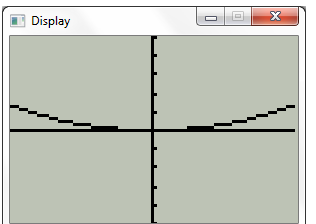
Figure 30
The graph of the function is defined at the required point the limit of the function exists at the defined point.
Chapter 12 Solutions
Precalculus with Limits


- The correct answer is Ccould you show me how to do it by finding a0 and and akas well as setting up the piecewise function and integratingarrow_forwardT 1 7. Fill in the blanks to write the calculus problem that would result in the following integral (do not evaluate the interval). Draw a graph representing the problem. So π/2 2 2πxcosx dx Find the volume of the solid obtained when the region under the curve on the interval is rotated about the axis.arrow_forward38,189 5. Draw a detailed graph to and set up, but do not evaluate, an integral for the volume of the solid obtained by rotating the region bounded by the curve: y = cos²x_for_ |x| ≤ and the curve y y = about the line x = =플 2 80 F3 a FEB 9 2 7 0 MacBook Air 3 2 stv DGarrow_forward
- Find f(x) and g(x) such that h(x) = (fog)(x) and g(x) = 3 - 5x. h(x) = (3 –5x)3 – 7(3 −5x)2 + 3(3 −5x) – 1 - - - f(x) = ☐arrow_forwardx-4 Let f(x)=5x-1, h(x) = Find (fo h)(0). 3 (fo h)(0) = (Type an integer or a fraction.)arrow_forwardFill in the blanks to write the calculus problem that would result in the following integral (do not evaluate the interval). Draw a graph representing the problem. π/2 So/² 2xcosx dx Find the volume of the solid obtained when the region under the curve 38,189 on the interval is rotated about the axis.arrow_forward
- Let f(x) = -5x-1, g(x) = x² + 5, h(x) = · x+4 3 Find (hog of)(1). (hogof)(1)= (Simplify your answer. Type an integer or a decimal.)arrow_forwardFor the given function, find (a) the equation of the secant line through the points where x has the given values and (b) the equation of the tangent line when x has the first value. y= f(x) = x²+x; x=-1,x=2 a. Which of the following formulas can be used to find the slope of the secant line? ○ A. 2-(-1) f(2) f(-1) 2+(-1) C. 1(2)+(-1) The equation of the secant line is 1(2)+(-1) О в. 2+(-1) f(2)-(-1) D. 2-(-1)arrow_forwardplease do not use chat gptarrow_forward
 Calculus: Early TranscendentalsCalculusISBN:9781285741550Author:James StewartPublisher:Cengage Learning
 Thomas' Calculus (14th Edition)CalculusISBN:9780134438986Author:Joel R. Hass, Christopher E. Heil, Maurice D. WeirPublisher:PEARSON
 Calculus: Early Transcendentals (3rd Edition)CalculusISBN:9780134763644Author:William L. Briggs, Lyle Cochran, Bernard Gillett, Eric SchulzPublisher:PEARSON
 Calculus: Early TranscendentalsCalculusISBN:9781319050740Author:Jon Rogawski, Colin Adams, Robert FranzosaPublisher:W. H. Freeman
 Calculus: Early Transcendental FunctionsCalculusISBN:9781337552516Author:Ron Larson, Bruce H. EdwardsPublisher:Cengage Learning