
Concept explainers
Videos
To Explain: that whether the state for performing inference about the regression model are met or not.
Answer to Problem 5E
Conditions have been met.
Explanation of Solution
Given:
There are total five conditions for the regression inferences are normal, equal variance, random, independent and linear.
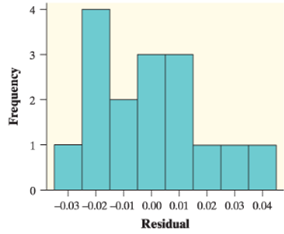
Normal: satisfied, the reason is that the histogram is bell shaped.
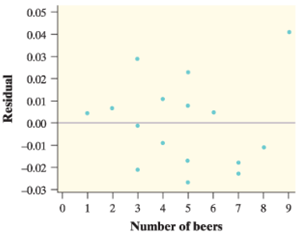
Equal variance: satisfied, the reason is that the vertical spread of points in the residual figure is approximately the same everywhere.
Random: satisfied, the reason is that the subject were arbitrary assigned.
Independent: satisfied, because the subjects were arbitrary assigned.
Linear: satisfied, because of all points in the residual figure are centred approximately zero.
Therefore all states or conditions have been satisfied.
Chapter 12 Solutions
PRACTICE OF STATISTICS F/AP EXAM
Additional Math Textbook Solutions
Calculus: Early Transcendentals (2nd Edition)
Introductory Statistics
Basic Business Statistics, Student Value Edition
Calculus for Business, Economics, Life Sciences, and Social Sciences (14th Edition)
A First Course in Probability (10th Edition)
A Problem Solving Approach To Mathematics For Elementary School Teachers (13th Edition)


- A marketing agency wants to determine whether different advertising platforms generate significantly different levels of customer engagement. The agency measures the average number of daily clicks on ads for three platforms: Social Media, Search Engines, and Email Campaigns. The agency collects data on daily clicks for each platform over a 10-day period and wants to test whether there is a statistically significant difference in the mean number of daily clicks among these platforms. Conduct ANOVA test. You can provide your answer by inserting a text box and the answer must include: also please provide a step by on getting the answers in excel Null hypothesis, Alternative hypothesis, Show answer (output table/summary table), and Conclusion based on the P value.arrow_forwardA company found that the daily sales revenue of its flagship product follows a normal distribution with a mean of $4500 and a standard deviation of $450. The company defines a "high-sales day" that is, any day with sales exceeding $4800. please provide a step by step on how to get the answers Q: What percentage of days can the company expect to have "high-sales days" or sales greater than $4800? Q: What is the sales revenue threshold for the bottom 10% of days? (please note that 10% refers to the probability/area under bell curve towards the lower tail of bell curve) Provide answers in the yellow cellsarrow_forwardBusiness Discussarrow_forward
 MATLAB: An Introduction with ApplicationsStatisticsISBN:9781119256830Author:Amos GilatPublisher:John Wiley & Sons Inc
 Probability and Statistics for Engineering and th...StatisticsISBN:9781305251809Author:Jay L. DevorePublisher:Cengage Learning
 Statistics for The Behavioral Sciences (MindTap C...StatisticsISBN:9781305504912Author:Frederick J Gravetter, Larry B. WallnauPublisher:Cengage Learning
 Elementary Statistics: Picturing the World (7th E...StatisticsISBN:9780134683416Author:Ron Larson, Betsy FarberPublisher:PEARSON
 The Basic Practice of StatisticsStatisticsISBN:9781319042578Author:David S. Moore, William I. Notz, Michael A. FlignerPublisher:W. H. Freeman
 Introduction to the Practice of StatisticsStatisticsISBN:9781319013387Author:David S. Moore, George P. McCabe, Bruce A. CraigPublisher:W. H. Freeman