
Videos
(a)
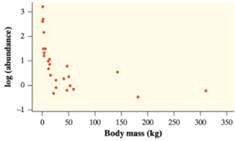
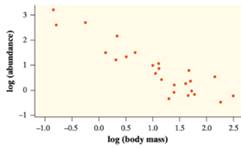
To Explain: the better relationship between abundance and body mass.
(a)
Answer to Problem 48E
Power model
Explanation of Solution
Given:
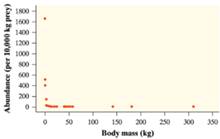
It is observed that the given
General linear model to expect log(abundance) and log(body mass).
Taking the exponential
Therefore the model associate with the model
(b)
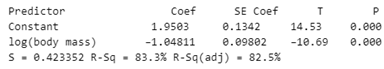
To find: the equation of the least-squares regression line on the basis of given computer output.
(b)
Answer to Problem 48E
Explanation of Solution
Given:

Calculation:
General equation for the least square regression line
The calculated of the constant
The calculated of the slope
Putting the value of
Taking the logarithm
Where
(c)
To Explain: the prediction of the abundance of black bears on the basis of part (b).
(c)
Answer to Problem 48E
0.775532 per 10000kg prey
Explanation of Solution
Given:
Calculation:
From the part (b)
Where
Putting the value of
Taking the exponential
Therefore the expected abundance is 0.775532 per 10000kg prey
(d)
To Calculate: here is given linear regression in part (b), is it expected that prediction in part (c) to be too large, too small or about right, justify the answer.
(d)
Answer to Problem 48E
About right
Explanation of Solution
Given:
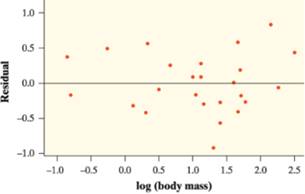
From the part (c) it is prediction for the body mass of 92.5 kilogram.
In the residual figure, it is observed that the dots between 1.5 and 2.0 are both below and above the horizontal line at 0. Moreover it is noticed that the horizontal line 0 lies in the mid between these dots and therefore it is expected that prediction at about 2 to be about right.
Chapter 12 Solutions
PRACTICE OF STATISTICS F/AP EXAM
Additional Math Textbook Solutions
Thinking Mathematically (6th Edition)
College Algebra (7th Edition)
Elementary Statistics (13th Edition)
A Problem Solving Approach To Mathematics For Elementary School Teachers (13th Edition)
University Calculus: Early Transcendentals (4th Edition)


- A marketing agency wants to determine whether different advertising platforms generate significantly different levels of customer engagement. The agency measures the average number of daily clicks on ads for three platforms: Social Media, Search Engines, and Email Campaigns. The agency collects data on daily clicks for each platform over a 10-day period and wants to test whether there is a statistically significant difference in the mean number of daily clicks among these platforms. Conduct ANOVA test. You can provide your answer by inserting a text box and the answer must include: also please provide a step by on getting the answers in excel Null hypothesis, Alternative hypothesis, Show answer (output table/summary table), and Conclusion based on the P value.arrow_forwardA company found that the daily sales revenue of its flagship product follows a normal distribution with a mean of $4500 and a standard deviation of $450. The company defines a "high-sales day" that is, any day with sales exceeding $4800. please provide a step by step on how to get the answers Q: What percentage of days can the company expect to have "high-sales days" or sales greater than $4800? Q: What is the sales revenue threshold for the bottom 10% of days? (please note that 10% refers to the probability/area under bell curve towards the lower tail of bell curve) Provide answers in the yellow cellsarrow_forwardBusiness Discussarrow_forward
 MATLAB: An Introduction with ApplicationsStatisticsISBN:9781119256830Author:Amos GilatPublisher:John Wiley & Sons Inc
 Probability and Statistics for Engineering and th...StatisticsISBN:9781305251809Author:Jay L. DevorePublisher:Cengage Learning
 Statistics for The Behavioral Sciences (MindTap C...StatisticsISBN:9781305504912Author:Frederick J Gravetter, Larry B. WallnauPublisher:Cengage Learning
 Elementary Statistics: Picturing the World (7th E...StatisticsISBN:9780134683416Author:Ron Larson, Betsy FarberPublisher:PEARSON
 The Basic Practice of StatisticsStatisticsISBN:9781319042578Author:David S. Moore, William I. Notz, Michael A. FlignerPublisher:W. H. Freeman
 Introduction to the Practice of StatisticsStatisticsISBN:9781319013387Author:David S. Moore, George P. McCabe, Bruce A. CraigPublisher:W. H. Freeman