
Videos
(a)
To Explain: the better relationship between percent made and distance.
(a)
Answer to Problem 47E
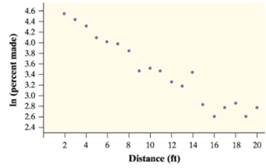
Exponential model
Explanation of Solution
Given:
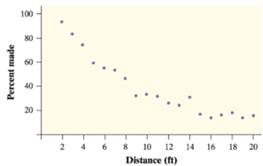
It is observed that the given
General linear model to expect ln(count) from time
Taking the exponential
Therefore the model associate with the model
(b)
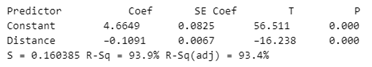
To find: the equation of the least-squares regression line on the basis of given computer output.
(b)
Answer to Problem 47E
Explanation of Solution
Given:
Calculation:
General equation for the least square regression line
The calculated of the constant
The calculated of the slope
Putting the value of
Where x shows the distance and y shows the ln(percent made)
Where
(c)
To Explain: the prediction of the percent made for putts of 21 feet on the basis of part (b).
(c)
Answer to Problem 47E
10.7381%
Explanation of Solution
Given:

Calculation:
From the part (b)
Where
Putting the value of
Taking the exponential
Therefore the expected percent made is 10.7381
(d)
To Calculate: here is given linear regression in part (b), is it expected that prediction in part (c) to be too large, too small or about right, justify the answer.
(d)
Answer to Problem 47E
Too small
Explanation of Solution
Given:
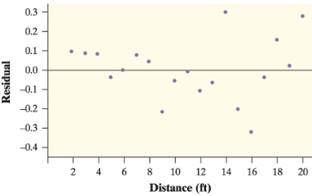
It is observed that, made a prediction for a distance of
Then residual is the difference between the predicted y-value and actual y-value. If a residual is positive, then this means that the actual y-value is larger than the
Chapter 12 Solutions
PRACTICE OF STATISTICS F/AP EXAM
Additional Math Textbook Solutions
Elementary Statistics: Picturing the World (7th Edition)
A First Course in Probability (10th Edition)
Introductory Statistics
Elementary Statistics (13th Edition)
Algebra and Trigonometry (6th Edition)
Basic Business Statistics, Student Value Edition


- A marketing agency wants to determine whether different advertising platforms generate significantly different levels of customer engagement. The agency measures the average number of daily clicks on ads for three platforms: Social Media, Search Engines, and Email Campaigns. The agency collects data on daily clicks for each platform over a 10-day period and wants to test whether there is a statistically significant difference in the mean number of daily clicks among these platforms. Conduct ANOVA test. You can provide your answer by inserting a text box and the answer must include: also please provide a step by on getting the answers in excel Null hypothesis, Alternative hypothesis, Show answer (output table/summary table), and Conclusion based on the P value.arrow_forwardA company found that the daily sales revenue of its flagship product follows a normal distribution with a mean of $4500 and a standard deviation of $450. The company defines a "high-sales day" that is, any day with sales exceeding $4800. please provide a step by step on how to get the answers Q: What percentage of days can the company expect to have "high-sales days" or sales greater than $4800? Q: What is the sales revenue threshold for the bottom 10% of days? (please note that 10% refers to the probability/area under bell curve towards the lower tail of bell curve) Provide answers in the yellow cellsarrow_forwardBusiness Discussarrow_forward
- The following data represent total ventilation measured in liters of air per minute per square meter of body area for two independent (and randomly chosen) samples. Analyze these data using the appropriate non-parametric hypothesis testarrow_forwardeach column represents before & after measurements on the same individual. Analyze with the appropriate non-parametric hypothesis test for a paired design.arrow_forwardShould you be confident in applying your regression equation to estimate the heart rate of a python at 35°C? Why or why not?arrow_forward
- Given your fitted regression line, what would be the residual for snake #5 (10 C)?arrow_forwardCalculate the 95% confidence interval around your estimate of r using Fisher’s z-transformation. In your final answer, make sure to back-transform to the original units.arrow_forwardCalculate Pearson’s correlation coefficient (r) between temperature and heart rate.arrow_forward
 MATLAB: An Introduction with ApplicationsStatisticsISBN:9781119256830Author:Amos GilatPublisher:John Wiley & Sons Inc
 Probability and Statistics for Engineering and th...StatisticsISBN:9781305251809Author:Jay L. DevorePublisher:Cengage Learning
 Statistics for The Behavioral Sciences (MindTap C...StatisticsISBN:9781305504912Author:Frederick J Gravetter, Larry B. WallnauPublisher:Cengage Learning
 Elementary Statistics: Picturing the World (7th E...StatisticsISBN:9780134683416Author:Ron Larson, Betsy FarberPublisher:PEARSON
 The Basic Practice of StatisticsStatisticsISBN:9781319042578Author:David S. Moore, William I. Notz, Michael A. FlignerPublisher:W. H. Freeman
 Introduction to the Practice of StatisticsStatisticsISBN:9781319013387Author:David S. Moore, George P. McCabe, Bruce A. CraigPublisher:W. H. Freeman