Concept explainers
(a)
Draw the influence line for the positive moment at section B using moment distribution method.
(a)
Explanation of Solution
Influence line for the moment at support B.
Influence lines will be constructed by placing the unit load at every 20 ft interval from A along the span of the beam. The points are indicated by the circled numbers.
To establish the influence line ordinate at the left end (point 1), the unit load is placed on the beam directly over support A. Since the entire load passes directly into the support, the beam is unstressed. Therefore,
Similarly, if the unit load is moved at C and D,
Case 1:
Apply unit load at 20 ft from A. (point 2).
Draw the beam with points of applying unit load at B (point 2) as in Figure 1.
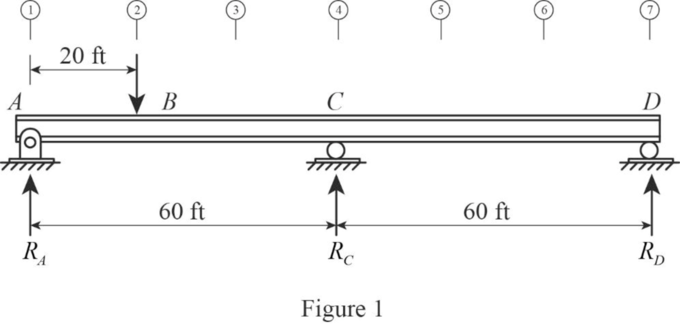
Refer Figure 1.
Find the fixed end moment at each end of the member CD as follows;
Find the fixed end moment at each end of the member CA as follows;
Find the distribution factor.
Show the computation of distribution factor as in Table 1.
| Joints | Member | Stiffness, K | ||
| C | CA | |||
| CD |
Show the moment distribution computations as in Table 2.
| Joint | A | C | D | ||
| Member | AC | CA | CD | DC | |
| DF | 0.5 | 0.5 | |||
| FEM | ‑8.89 | 4.44 | 0 | 0 | |
| Released moment | +8.89 | 0 | 0 | 0 | |
| COM | 0 | 4.44 | 0 | ||
| Total | 0 | 8.88 | 0 | 0 | |
| DEM | ‑4.44 | ‑4.44 | |||
| COM | |||||
| Final | 0 | 4.44 | ‑4.44 | 0 | |
Find the reaction at A using section AC.
Draw the free body diagram of section AC as in Figure 2.
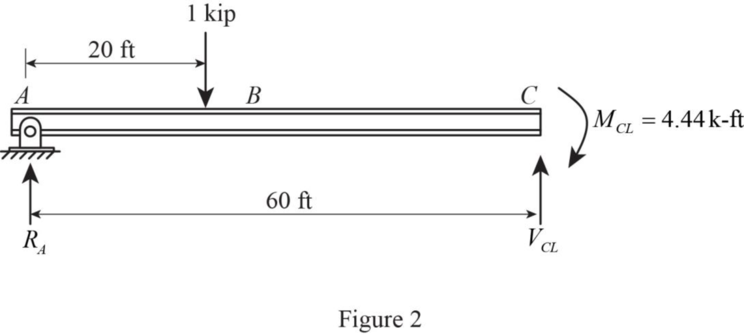
Refer Figure 1.
Find the reaction at A.
Consider moment at C
Find the moment at B.
Consider moment at B
Thus, the influence line ordinate of moment at B when 1 kip applied at B is 11.86.
Case 2:
Apply unit load at 20 ft from C. (point 5).
Draw the beam with points of applying at point 5 as in Figure 3.
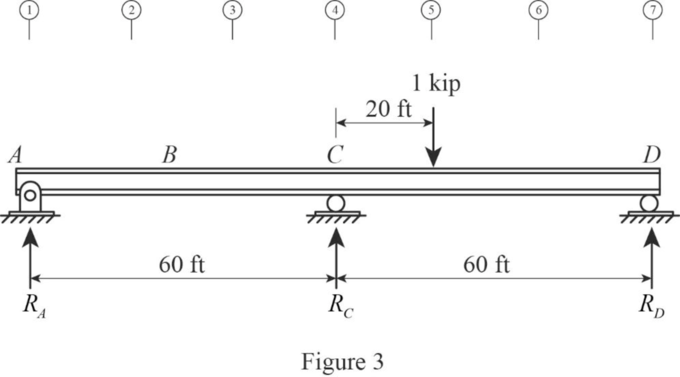
Refer Figure 3.
Find the fixed end moment at each end of the member CD as follows;
Find the fixed end moment at each end of the member DC as follows;
Show the moment distribution computations as in Table 3.
| Joint | A | C | D | ||
| Member | AC | CA | CD | DC | |
| DF | 0.5 | 0.5 | |||
| FEM | 0 | 0 | ‑8.89 | 4.440 | |
| Released moment | 0 | 0 | 0 | ‑4.44 | |
| COM | 0 | 0 | ‑2.22 | ||
| Total | 0 | 0 | ‑11.11 | 0 | |
| DEM | +5.56 | +5.56 | |||
| COM | |||||
| Final | 0 | 5.56 | ‑5.56 | 0 | |
Find the reaction at A using section AC.
Draw the free body diagram of section AC as in Figure 4.
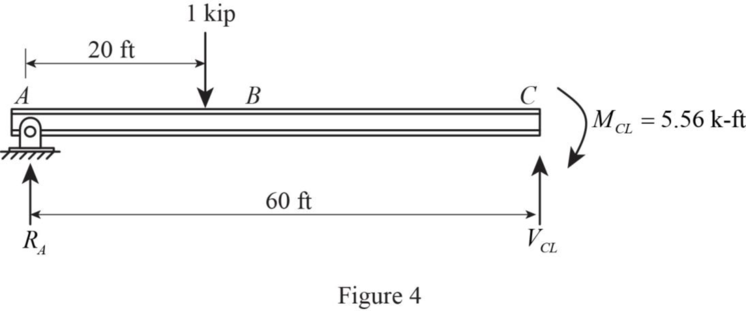
Refer Figure 4.
Find the reaction at A.
Consider moment at C
Find the moment at B.
Consider moment at B
Thus, the influence line ordinate of moment at B when 1 kip applied at point 5 is ‑1.876.
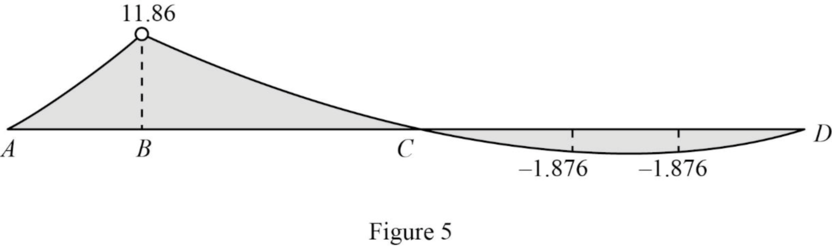
Similarly calculate the influence line ordinate by applying the points 3 and 5 and tabulate the values as in Table 4.
| Apply 1 k at point | Influence line ordinate of moment at B. |
| 1 | 0 |
| 2 | 11.86 |
| 4 | 0 |
| 5 | ‑1.876 |
| 6 | ‑1.876 |
| 7 | 0 |
Draw the influence line diagram of influence line ordinate of moment at B using Table 4 as in Figure 5.
(b)
Find the maximum moment at B for the given loading condition.
(b)
Answer to Problem 53P
The maximum moment at B for the given loading condition is
Explanation of Solution
Consider the uniformly distributed load of 2 kips/ft act on the span AC only and the concentrated live load of 20 kips act at B.
Draw the free body diagram of the beam for the given loading as in Figure 6.
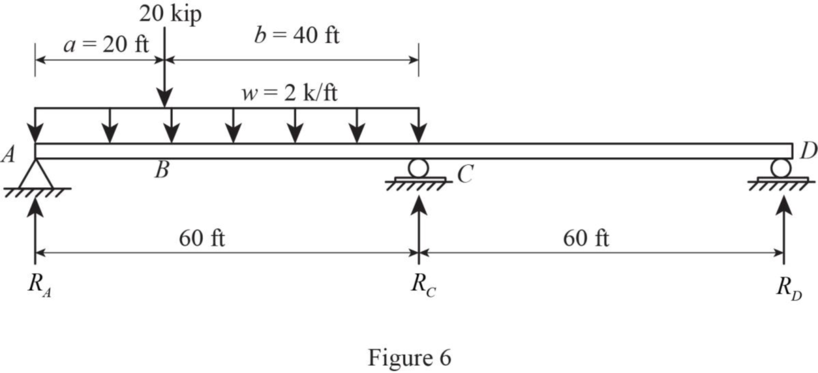
Refer Figure 6.
Find the fixed end moment at each end of the member AC as follows;
Find the fixed end moment at each end of the member CA as follows;
Show the moment distribution computations as in Table 5.
| Joint | A | C | D | ||
| Member | AC | CA | CD | DC | |
| DF | 0.5 | 0.5 | |||
| FEM | ‑777.78 | 688.89 | 0 | 0 | |
| Released moment | +777.78 | 00 | 0 | 0 | |
| COM | 388.89 | ||||
| Total | 0 | 1,077.78 | 0 | 0 | |
| DEM | ‑538.89 | ‑538.89 | |||
| COM | |||||
| Final | 0 | 538.89 | ‑538.89 | 0 | |
Find the reaction at A using section AC.
Draw the free body diagram of section AC as in Figure 7.
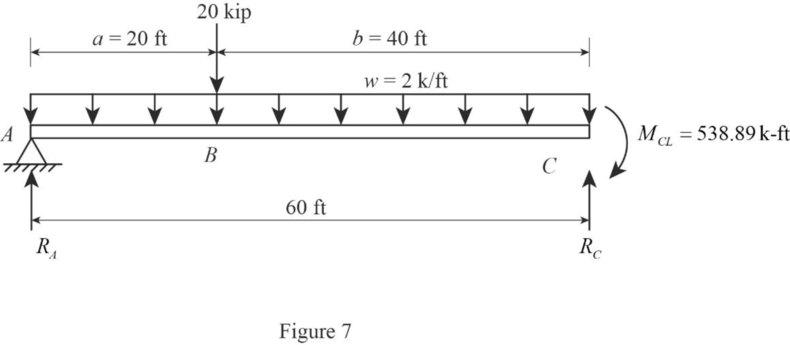
Refer Figure 7.
Find the reaction at A.
Consider moment at C
Find the moment at B.
Consider moment at B
Therefore, the maximum moment at B for the given loading condition is
(c)
Find the maximum moment at B due to wheel loads using moment distribution method.
(c)
Answer to Problem 53P
The maximum moment at B due to wheel loads using moment distribution method is
Explanation of Solution
The maximum moment at B is produced when wheel load is placed at B.
Draw the free body diagram of the beam for the wheel loading as in Figure 8.
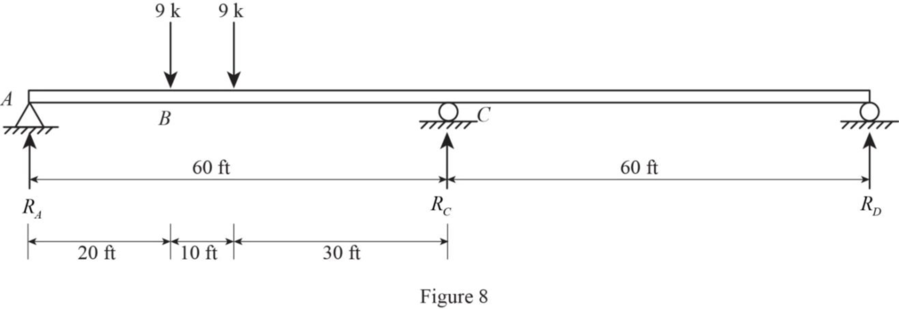
Refer Figure 8.
Find the fixed end moment at each end of the member AC as follows;
Find the fixed end moment at each end of the member CA as follows;
Show the moment distribution computations as in Table 6.
| Joint | A | C | D | ||
| Member | AC | CA | CD | DC | |
| DF | 0.5 | 0.5 | |||
| FEM | ‑147.5 | 107.5 | 0 | 0 | |
| Released moment | +147.5 | 0 | 0 | 0 | |
| COM | 73.75 | ||||
| Total | 0 | 181.25 | 0 | 0 | |
| DEM | ‑90.63 | 90.63 | |||
| COM | |||||
| Final | 0 | ‑90.63 | 90.63 | 0 | |
Find the reaction at A using section AC.
Draw the free body diagram of section AC as in Figure 9.
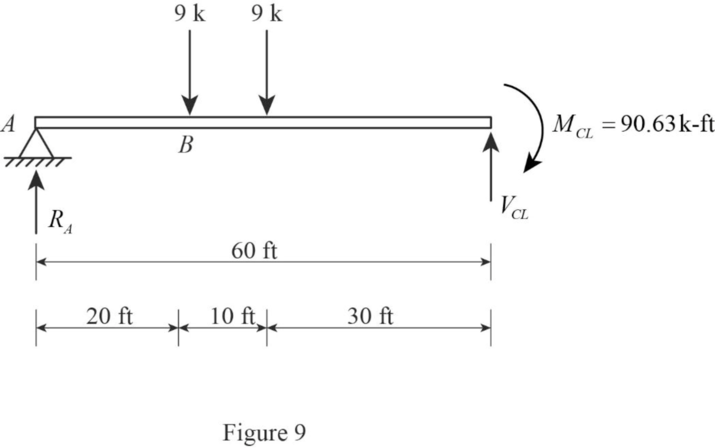
Refer Figure 7.
Find the reaction at A.
Consider moment at C
Find the moment at B.
Consider moment at B
Therefore, the maximum moment at B for the given loading condition is
Want to see more full solutions like this?
Chapter 12 Solutions
Fundamentals of Structural Analysis


- Determine the minimum possible surface area of a secondary clarifier treating activated sludge with a design influent flow rate (Q) of 1,000 m³/d, a return activated sludge (RAS) recycling ratio of 25%, and a mixed liquor total suspended solids (MLSS) concentration of 4,000 mg/L, if the overflow rate must be less than 33 m/d and the solids loading rate must be less than 250 kg/m²/d. Express your answer in m² and round up to the next integer.arrow_forwardEstimate the required air flow rate for the new activated sludge plant at Pea Ridge (Problems 23-223-723-10, and 23-13). The flow rate is 8,450 m³/day, the concentration of bCOD going into the system (So) is 137 mg/L, the concentration of bCOD leaving the system (S) is 16.3 mg/L, and the mass of cells produced per day (Pxvss) is 277.4 kg/d. Use the following assumptions to estimate the required air flow rate: . Clean water correction, a = 0.50 . Salinity correction, B = 0.95 Fouling factor = 0.9 Wastewater temperature = 12°C Atmospheric pressure = 101.325 kPa .Elevation 500 m . Depth of aerator = 5.6 m Operating DO 2.0 mg/L Percent oxygen leaving aeration tank - 19% ■ Manufacturer's SOTR = 535 kg/d Manufacturer's air flow rate at standard conditions 50 m³/d - aerator Express your answer with the units of m³/d and round to the nearest integer.arrow_forwardDetermine the required solids retention time (SRT) of a completely mixed activated sludge aeration tank for a conventional activated sludge system treating a design flow rate of 34,560 m³/d, where the effluent standards are 30.0 mg/L for BODs and 30.0 mg/L for total suspended solids (TSS). Assume that the BOD5 of the effluent TSS is 70% of the TSS concentration. Assume the BODs concentration leaving the primary clarifier is 128 mg/L that the MLVSS concentration (X₂) is 2,500 mg/L. Assume the following values for the growth constants: Ks 100 mg/L BODS ⚫ Hm - 2.5 d 1 kd = 0.050 d 1 Y = 0.50 mg VSS/mg BODs removed Express your answer in days and round to the nearest 0.1.arrow_forward
- Q1: Figure below shows loaded beam with its cross-section area, (A) Draw shear force and bending moment diagrams, stating the main values, (B) Find central slope and deflection, (C) Sketch the distribution of shear stress at left support, (D) Find maximum tensile and compressive bending stresses set up in beam at right support. E-205GN/m² P1 P2 P3 W1 W2 Lin Lin # A Length in (m) and loads in kN 3a a 2a 2a (Cross-section area, All dimensions in (mm))arrow_forwardEstimate the mass of oxygen to be supplied for a new activated sludge plant at Pea Ridge to treat a flow rate of 8,450 m³/day. Assume that the concentration of bCOD going into the system (So) is 137 mg/L, that the bCOD leaving the system (S) is 16.3 mg/L, and that the mass of cells produced per day (Pxvss) is 277.4 kg/d. Express your answer in kg/day and round to the nearest integer.arrow_forward*10-4. Determine the internal moments at the supports A, B, and C, then draw the moment diagram. Assume A is pinned, and B and C are rollers. El is constant. 3 k/ft 8 ft- 8 ft -4 ft-arrow_forward
- Q2: Determine the change in dimensions in each section of the bar shown in figure. The portion AB is circular section and portion BC is rectangular section. E=115GN/m², v=0.33. L1 L2 P2+ P2 B Q3: A block is subjected to the stresses as shown in figure, find: principal stresses, shear stress with their directions and the normal and shear stresses on a plane inclined at 0. All stresses in MPa. (Confirm your answer by means of Mohr's stress circle). Txy 30 Note: (1) For all questions the student can choose any values of P1, P2, P3, W1, W2, a, σ (MPa), Txy (MPa), 0°, length and the dimensions of cross section area.arrow_forwardFor the gravity concrete dam shown in the figure, the following data are available: Unit weight of concrete (y)-2.4 ton/m Neglect Wave pressure, silt pressure, ice force and earth quake force) -0.65, (7)-1 ton/m Find factor of safety against sliding and overturning (F.Sa & FS), If heel and toe stresses (Pa & Pen) are 57.17ton/m² and 84.53 ton/m² respectively. w.s.l 83m Solve and sketch on paper 10m 80m 8marrow_forwardNeed assistance with d.arrow_forward
- 2. A series of gears are mounted on a 40mm diameter steel shaft. Take G = 75 GPa. (i) Draw the torque load diagram. (ii) Determine the angle of twist of gear B relative to gear A. (iii) Determine the maximum shear stress and it's location along the shaft. 600 N-m 900 N-m 200 mm 200 mm 200 mm 500 Nm 300 N·m 200 mm 500 N-marrow_forward1. The figure below shows a circular shaft with three sections. The length of each section is 50mm. (E 500 MPa). = (i) Draw the axial load diagram of the circular shaft. (ii) Determine the average normal stress at points A, B and C. (iii) Determine the maximum deformation and it's location along the shaft. 10 mm 5 mm 5 mm B 300 N A 900 N 800 N C 200 Narrow_forward02: For the gravity concrete dam shown in the figure, (the vertical stresses at toe and heel ((Pmax & Pmin) are 199 and 52 ton/m respectively. following data are available:- -Unit weight of concrete (ycone)-24 ton/m³ -Neglect Wave pressure, silt pressure, ice force and earth quake force. #-0.65 Find factor of safety against sliding and overturning (F.Sslid & F.Sover) AS 115 m 8 m 120 m Solve with sketch on paperarrow_forward

 Structural Analysis (10th Edition)Civil EngineeringISBN:9780134610672Author:Russell C. HibbelerPublisher:PEARSON
 Principles of Foundation Engineering (MindTap Cou...Civil EngineeringISBN:9781337705028Author:Braja M. Das, Nagaratnam SivakuganPublisher:Cengage Learning
 Fundamentals of Structural AnalysisCivil EngineeringISBN:9780073398006Author:Kenneth M. Leet Emeritus, Chia-Ming Uang, Joel LanningPublisher:McGraw-Hill Education
 Traffic and Highway EngineeringCivil EngineeringISBN:9781305156241Author:Garber, Nicholas J.Publisher:Cengage Learning