Concept explainers
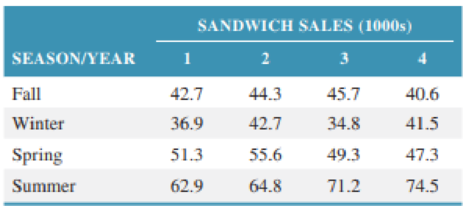
Townside Food Vending operates vending machines in office buildings, the airport, bus stations, colleges, and other businesses and agencies around town and operates vending trucks for building and construction sites. The company believes its sandwich sales follow a seasonal pattern. It has accumulated the following data for sandwich sales per season during the past four years.

Develop a seasonally adjusted
Want to see the full answer?
Check out a sample textbook solution
Chapter 12 Solutions
Operations and Supply Chain Management, 9th Edition WileyPLUS Registration Card + Loose-leaf Print Companion
Additional Business Textbook Solutions
Operations Management: Processes and Supply Chains (12th Edition) (What's New in Operations Management)
Auditing And Assurance Services
Fundamentals of Management (10th Edition)
Gitman: Principl Manageri Finance_15 (15th Edition) (What's New in Finance)
Marketing: An Introduction (13th Edition)
Financial Accounting, Student Value Edition (5th Edition)
- Use the internet to obtain crash safety ratings for passenger vehicles. Then, answer thesequestions:a. Which vehicles received the highest ratings? The lowest ratings?b. How important are crash-safety ratings to new car buyers? Does the degree of importancedepend on the circumstances of the buyer?c. Which types of buyers would you expect to be the most concerned with crash-safety ratings?d. Are there other features of a new car that might sway a buyer from focusing solely on crashsafety? If so, what might they be?arrow_forward“Implementing a Performance Management Communication Plan at Accounting, Inc.” Evaluate Accounting Inc.’s communication plan. Specifically, does it answer all of the questions that a good communication plan should answer? Which questions are left unanswered? How would you provide answers to the unanswered questions? “Implementing an Appeals Process at Accounting, Inc.” If you were to design an appeals process to handle these complaints well, what would be the appeal process? Describe the recommended process and why.arrow_forwardThe annual demand for water bottles at Mega Stores is 500 units, with an ordering cost of Rs. 200 per order. If the annual inventory holding cost is estimated to be 20%. of unit cost, how frequently should he replenish his stocks? Further, suppose the supplier offers him a discount on bulk ordering as given below. Can the manager reduce his costs by taking advantage of either of these discounts? Recommend the best ordering policy for the store. Order size Unit cost (Rs.) 1 – 49 pcs. 20.00 50 – 149 pcs. 19.50 150 – 299 pcs. 19.00 300 pcs. or more 18.00arrow_forward
- Help answer showing level work and formulasarrow_forwardI need to forecast using a 3-Period-Moving-Average-Monthly forecasting model which I did but then I need to use my forecast numbers to generate a Master Production Schedule (MPS) I have to Start with actual sales (my own test data numbers) for August-2022 Oct-2022 i need to create MPS to supply demand starting November-2022 April 2023 I just added numbers without applying formulas to the mps on the right side of the spreadsheet because I do not know how to do it. The second image is the example of what it should look like. Thank You.arrow_forwardSolve the following Question 1. How do volume and variety affect the process selection and layout types? Discuss 2. How is the human resource aspect important to operation function? Discuss 3. Discuss the supply network design and its impact on the overall performance of the organization.arrow_forward
- The supply chain is a conventional notion, but organizations are only really interested in making products that they can sell to customers. Provided they have reliable supplies of materials and reasonable transport for finished products, logistics is irrelevant. Do you think this is true? If yes, explain, and if no, clearly explain as well.arrow_forwardworking as a program operations managerarrow_forward12 X1, X230 1 x =0x2 write the Following linear Programming model by 1- general Form Canonical Forms Canonical formY 2- Standard Form Max Z=35X+ 4 X 2 +6 X3 ST. X+2X2-5x3 = 40 3X, + 6X2 + 7x 3 = 30 7x, +lox2 x3 = 50 X3 X 2 X 3 <0arrow_forward
 Contemporary MarketingMarketingISBN:9780357033777Author:Louis E. Boone, David L. KurtzPublisher:Cengage LearningMarketingMarketingISBN:9780357033791Author:Pride, William MPublisher:South Western Educational Publishing
 Practical Management ScienceOperations ManagementISBN:9781337406659Author:WINSTON, Wayne L.Publisher:Cengage,


