
Videos
Graph the demand data in Problem 12.3. Can you identify any trends, cycles, and/or seasonal patterns?
The LawnPlus Fertilizer Company distributes fertilizer to various lawn and garden shops. The company must base its quarterly production
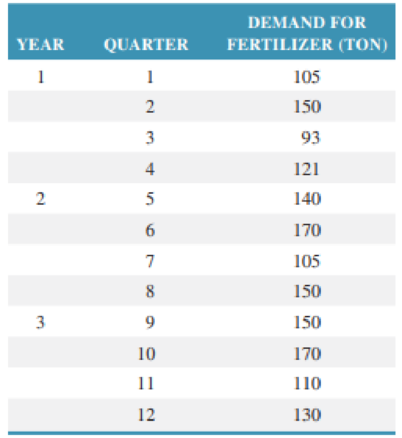
- a. Compute a three-quarter moving average forecast for quarters 4 through 13 and compute the forecast error for each quarter.
- b. Compute a five-quarter moving average forecast for quarters 6 through 13 and compute the forecast error for each quarter.
- c. Compute a weighted three-quarter moving average forecast using weights of .50, .33, and .17 for the most recent, next recent, and most distant data, respectively, and compute the forecast error for each quarter.
- d. Compare the forecasts developed in parts (a), (b), and (c) using cumulative error. Which forecast appears to be most accurate? Do any exhibit any bias?
Want to see the full answer?
Check out a sample textbook solution
Chapter 12 Solutions
Operations and Supply Chain Management, 9th Edition WileyPLUS Registration Card + Loose-leaf Print Companion
Additional Business Textbook Solutions
Marketing: An Introduction (13th Edition)
Engineering Economy (17th Edition)
Intermediate Accounting (2nd Edition)
Principles of Operations Management: Sustainability and Supply Chain Management (10th Edition)
Horngren's Accounting (12th Edition)
Corporate Finance (4th Edition) (Pearson Series in Finance) - Standalone book


- Travelling and working internationally can lead to a life of adventure and unique career experiences. For businesses, selecting the right candidates to take on foreign assignments can propel, delay, or deny the success of the international ventures. As an international manager, identify key competencies you would look for in choosing expatriates. What might be some of their concerns in taking on overseas assignments? What are some best practices in supporting expats during and after their assignments?arrow_forwardTravelling and working internationally can lead to a life of adventure and unique career experiences. For businesses, selecting the right candidates to take on foreign assignments can propel, delay, or deny the success of the international ventures. As an international manager, identify key competencies you would look for in choosing expatriates. What might be some of their concerns in taking on overseas assignments? What are some best practices in supporting expats during and after their assignments?arrow_forwardI need answer typing clear urjent no chatgpt used pls i will give 5 Upvotes.arrow_forward
- I need answer typing clear urjent no chatgpt used pls i will give 5 Upvotes. Pls full explanationarrow_forwardCariveh Co sells automotive supplies from 25 different locations in one country. Each branch has up to 30 staff working there, although most of the accounting systems are designed and implemented from the company's head office. All accounting systems, apart from petty cash, are computerised, with the internal audit department frequently advising and implementing controls within those systems. Cariveh has an internal audit department of six staff, all of whom have been employed at Cariveh for a minimum of five years and some for as long as 15 years. In the past, the chief internal auditor appoints staff within the internal audit department, although the chief executive officer (CEO) is responsible for appointing the chief internal auditor. The chief internal auditor reports directly to the finance director. The finance director also assists the chief internal auditor in deciding on the scope of work of the internal audit department. You are an audit manager in the internal audit…arrow_forwardCariveh Co sells automotive supplies from 25 different locations in one country. Each branch has up to 30 staff working there, although most of the accounting systems are designed and implemented from the company's head office. All accounting systems, apart from petty cash, are computerised, with the internal audit department frequently advising and implementing controls within those systems. Cariveh has an internal audit department of six staff, all of whom have been employed at Cariveh for a minimum of five years and some for as long as 15 years. In the past, the chief internal auditor appoints staff within the internal audit department, although the chief executive officer (CEO) is responsible for appointing the chief internal auditor. The chief internal auditor reports directly to the finance director. The finance director also assists the chief internal auditor in deciding on the scope of work of the internal audit department. You are an audit manager in the internal audit…arrow_forward
- Please show all steps and answers, thank you!arrow_forwardI am not sure if this is correct, because 8 cannot go directly to 10.arrow_forwardA practical application in real life to the Critical Path Method is the construction of a bridge with references, give a detailed essay on the stages involved in constructing a bridgearrow_forward
- Please assist in writing a complete reasearch project of the following title: Title of research: Study on the impact of Technology in the Work Place.arrow_forwardIntuition is both an emotional experience and a nonconscious analytic process. One problem, however, is that not all emotions signaling that there is a problem or opportunity represent intuition. Please in your Personal opinion how we would know if our “gut feelings” are intuition or not, and if not intuition, suggest what might be causing them.arrow_forwardA coworker suggests that the company where you both work would be much more effective if there were no organizational politics. Please in your personal and detailed opinion, What would you say to this person in reply?arrow_forward
 Contemporary MarketingMarketingISBN:9780357033777Author:Louis E. Boone, David L. KurtzPublisher:Cengage Learning
 MarketingMarketingISBN:9780357033791Author:Pride, William MPublisher:South Western Educational Publishing
 Purchasing and Supply Chain ManagementOperations ManagementISBN:9781285869681Author:Robert M. Monczka, Robert B. Handfield, Larry C. Giunipero, James L. PattersonPublisher:Cengage Learning
 Practical Management ScienceOperations ManagementISBN:9781337406659Author:WINSTON, Wayne L.Publisher:Cengage,