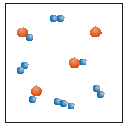
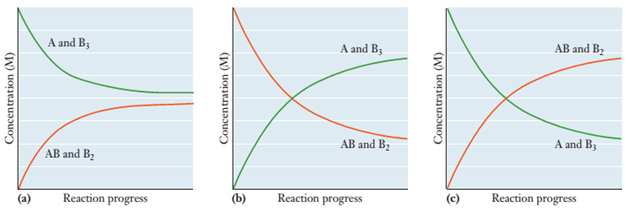
Equal amounts of two gases, A and B 3 , are placed in an evacuated container and react to form AB and B 2 . A ( g ) + B 3 ( g ) ⇄ AB ( g ) + B 2 ( g ) The molecular scale diagram represents the relative amounts of each substance present once equilibrium is reached. Which of the following graphs best describes the progress of the reaction as it proceeds to equilibrium? Explain why the graph you chose must be the correct one.
Equal amounts of two gases, A and B 3 , are placed in an evacuated container and react to form AB and B 2 . A ( g ) + B 3 ( g ) ⇄ AB ( g ) + B 2 ( g ) The molecular scale diagram represents the relative amounts of each substance present once equilibrium is reached. Which of the following graphs best describes the progress of the reaction as it proceeds to equilibrium? Explain why the graph you chose must be the correct one.
Solution Summary: The author analyzes how the graph that best describes the progress of the reaction should be identified.
Equal amounts of two gases, A and B3, are placed in an evacuated container and react to form AB and B2.
A
(
g
)
+
B
3
(
g
)
⇄
AB
(
g
)
+
B
2
(
g
)
The molecular scale diagram represents the relative amounts of each substance present once equilibrium is reached.
Which of the following graphs best describes the progress of the reaction as it proceeds to equilibrium? Explain why the graph you chose must be the correct one.
Consider the following gas chromatographs of Compound A, Compound B, and a mixture of Compounds A and B.
Inject
A
B
mixture
Area= 9
Area = 5
Area = 3
Area
Inject
.
མི།
Inject
J2
What is the percentage of Compound B in the the mixture?
Rank these according to stability.
CH3
H3C
CH3
1
CH3
H3C
1 most stable, 3 least stable
O 1 most stable, 2 least stable
2 most stable, 1 least stable
O2 most stable, 3 least stable
O3 most stable, 2 least stable
O3 most stable, 1 least stable
CH3
2
CH3
CH3
H₂C
CH3
3
CH3
CH
Consider this IR and NMR:
INFRARED SPECTRUM
TRANSMITTANCE
0.8-
0.6
0.4
0.2
3000
10
9
8
00
HSP-00-541
7
CO
6
2000
Wavenumber (cm-1)
сл
5
ppm
4
M
Which compound gave rise to these spectra?
N
1000
1
0
Chapter 12 Solutions
Bundle: Chemistry for Engineering Students, Loose-Leaf Version, 4th + OWLv2 with MindTap Reader with Student Solutions Manual, 1 term (6 months) Printed Access Card
Need a deep-dive on the concept behind this application? Look no further. Learn more about this topic, chemistry and related others by exploring similar questions and additional content below.
Author:Steven D. Gammon, Ebbing, Darrell Ebbing, Steven D., Darrell; Gammon, Darrell Ebbing; Steven D. Gammon, Darrell D.; Gammon, Ebbing; Steven D. Gammon; Darrell
Author:Steven D. Gammon, Ebbing, Darrell Ebbing, Steven D., Darrell; Gammon, Darrell Ebbing; Steven D. Gammon, Darrell D.; Gammon, Ebbing; Steven D. Gammon; Darrell


 General, Organic, and Biological ChemistryChemistryISBN:9781285853918Author:H. Stephen StokerPublisher:Cengage Learning
 General Chemistry - Standalone book (MindTap Cour...ChemistryISBN:9781305580343Author:Steven D. Gammon, Ebbing, Darrell Ebbing, Steven D., Darrell; Gammon, Darrell Ebbing; Steven D. Gammon, Darrell D.; Gammon, Ebbing; Steven D. Gammon; DarrellPublisher:Cengage Learning
 Introductory Chemistry: A FoundationChemistryISBN:9781337399425Author:Steven S. Zumdahl, Donald J. DeCostePublisher:Cengage Learning
 Chemistry for Engineering StudentsChemistryISBN:9781337398909Author:Lawrence S. Brown, Tom HolmePublisher:Cengage Learning
 Chemistry: The Molecular ScienceChemistryISBN:9781285199047Author:John W. Moore, Conrad L. StanitskiPublisher:Cengage Learning
 Chemistry: Matter and ChangeChemistryISBN:9780078746376Author:Dinah Zike, Laurel Dingrando, Nicholas Hainen, Cheryl WistromPublisher:Glencoe/McGraw-Hill School Pub Co