
Statistics for Business and Economics (13th Edition)
13th Edition
ISBN: 9780134506593
Author: James T. McClave, P. George Benson, Terry Sincich
Publisher: PEARSON
expand_more
expand_more
format_list_bulleted
Concept explainers
Videos
Textbook Question
Chapter 11.2, Problem 11.16LM
Construct a
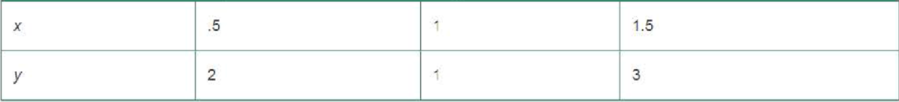
a. Plot the following two lines on your scatterplot:
b. Which of these lines would you choose to characterize the relationship between x and y? Explain.
c. Show that the sum of the errors of prediction for both of these lines equals 0.
d. Which of these lines has the smaller SSE?
e. Find the least squares line for the data and compare it with the two lines described in part a.
Expert Solution & Answer
Want to see the full answer?
Check out a sample textbook solution
Students have asked these similar questions
can you explain why my answer to Q2 was wrong and, how to get the correct answer
Business discuss
BUSINESS DISCUSS
Chapter 11 Solutions
Statistics for Business and Economics (13th Edition)
Ch. 11.1 - In each case, graph the line that passes through...Ch. 11.1 - Give the slope and y-intercept for each of the...Ch. 11.1 - The equation for a straight line (deterministic...Ch. 11.1 - Refer to Exercise 11.3. Find the equations of the...Ch. 11.1 - Plot the following lines: a. y 4 + x b. y = 5 2x...Ch. 11.1 - Give the slope and y-intercept for each of the...Ch. 11.1 - Prob. 11.7LMCh. 11.1 - Prob. 11.8LMCh. 11.1 - If a straight-line probabilistic relationship...Ch. 11.1 - Congress voting on women's issues. The American...
Ch. 11.1 - Best-paid CEOs. Refer to Glassdoor Economic...Ch. 11.1 - Estimating repair and replacement costs of water...Ch. 11.1 - Forecasting movie revenues with Twitter. A study...Ch. 11.2 - The following table is similar to Table 11.2.It is...Ch. 11.2 - Refer to Exercise 11.14. After the least squares...Ch. 11.2 - Construct a scatterplot for the data in the...Ch. 11.2 - Consider the following pairs of measurements: a....Ch. 11.2 - Use the applet Regression by Eye to explore the...Ch. 11.2 - In business, do nice guys finish first or last?...Ch. 11.2 - State Math SAT scores. Refer to the data on...Ch. 11.2 - Lobster fishing study. Refer to the Bulletin of...Ch. 11.2 - Repair and replacement costs of water pipes. Refer...Ch. 11.2 - Joint Strike Fighter program. The Joint Strike...Ch. 11.2 - Software millionaires and birthdays. In Outliers:...Ch. 11.2 - Prob. 11.24ACICh. 11.2 - Ranking driving performance of professional...Ch. 11.2 - Sweetness of orange juice. The quality of the...Ch. 11.2 - Forecasting movie revenues with Twitter. Marketers...Ch. 11.2 - Charisma of top-level leaders. According to a...Ch. 11.2 - Ran kings of research universities. Refer to the...Ch. 11.2 - Prob. 11.30ACACh. 11.3 - Visually compare the scatterplots shown below. If...Ch. 11.3 - Calculate SSE and s2 for each of the following...Ch. 11.3 - Suppose you fit a least squares line to 26 data...Ch. 11.3 - Refer to Exercise 11.14 (p. 629). Calculate SSE,...Ch. 11.3 - Do nice guys really finish last in business? Refer...Ch. 11.3 - State Math SAT scores. Refer to the simple linear...Ch. 11.3 - Prob. 11.37ACBCh. 11.3 - Prob. 11.38ACBCh. 11.3 - Prob. 11.39ACBCh. 11.3 - Prob. 11.40ACICh. 11.3 - Prob. 11.41ACICh. 11.3 - Sweetness of orange juice. Refer to the study of...Ch. 11.3 - Rankings of research universities. Refer to the...Ch. 11.3 - Life tests of cutting tools. To Improve the...Ch. 11.4 - Construct both a 95% and a 90% confidence interval...Ch. 11.4 - Consider the following pairs of observations: a....Ch. 11.4 - Refer to Exercise 11.46. Construct an 80% and a...Ch. 11.4 - Do the accompanying data provide sufficient...Ch. 11.4 - State Math SAT Scores. Refer to the SPSS simple...Ch. 11.4 - Lobster fishing study. Refer to the Bulletin of...Ch. 11.4 - Prob. 11.51ACBCh. 11.4 - Prob. 11.52ACBCh. 11.4 - Estimating repair and replacement costs of water...Ch. 11.4 - Prob. 11.54ACBCh. 11.4 - Prob. 11.55ACICh. 11.4 - Beauty and electoral success. Are good looks an...Ch. 11.4 - Prob. 11.57ACICh. 11.4 - Prob. 11.58ACICh. 11.4 - Prob. 11.59ACICh. 11.4 - Prob. 11.60ACICh. 11.4 - Rankings of research universities. Refer to the...Ch. 11.4 - Prob. 11.62ACACh. 11.4 - Does elevation impact hitting performance in...Ch. 11.5 - Explain what each of the following sample...Ch. 11.5 - Describe the slope of the least squares line if a....Ch. 11.5 - Construct a scatterplot for each data set. Then...Ch. 11.5 - Calculate r2 for the least squares line in each of...Ch. 11.5 - Use the applet Correlation by Eye to explore the...Ch. 11.5 - In business, do nice guys finish first or last?...Ch. 11.5 - Going for it on fourth-down in the NFL Each week...Ch. 11.5 - Lobster fishing study. Refer to the Bulletin of...Ch. 11.5 - RateMyProfessors.com. A popular Web site among...Ch. 11.5 - Last name and acquisition timing. Refer to the...Ch. 11.5 - Women in top management. An empirical analysis of...Ch. 11.5 - Prob. 11.74ACICh. 11.5 - Prob. 11.75ACICh. 11.5 - Prob. 11.76ACICh. 11.5 - Prob. 11.77ACICh. 11.5 - Prob. 11.78ACICh. 11.5 - Evaluation of an imputation method for missing...Ch. 11.5 - Prob. 11.80ACICh. 11.5 - Prob. 11.81ACACh. 11.6 - Consider the followings of measurements: a...Ch. 11.6 - Consider the pairs of measurements shown in the...Ch. 11.6 - In fitting a least squares line to n = 10 data...Ch. 11.6 - Prob. 11.86ACBCh. 11.6 - Prob. 11.87ACBCh. 11.6 - Prob. 11.88ACBCh. 11.6 - Prob. 11.89ACBCh. 11.6 - Prob. 11.90ACBCh. 11.6 - Prob. 11.91ACICh. 11.6 - Ranking driving performance of professional...Ch. 11.6 - Spreading rate of spilled liquid Refer to the...Ch. 11.6 - Removing nitrogen from toxic wastewater. Highly...Ch. 11.6 - Predicting quit rates In manufacturing The reasons...Ch. 11.6 - Life tests of cutting tools Refer to the data...Ch. 11.7 - Prices of recycled materials. Prices of recycled...Ch. 11.7 - Thickness of dust on solar cells. The performance...Ch. 11.7 - Management research In Africa. The editors of the...Ch. 11.7 - An MBAs work-life balance. The importance of...Ch. 11 - In fitting a least squares line ton= 15 data...Ch. 11 - Consider the following sample data. a. Construct a...Ch. 11 - Consider the following 10 data points. a. Plot the...Ch. 11 - Drug controlled-release rate study. The effect of...Ch. 11 - Metaskills and career management. Effective...Ch. 11 - Burnout of human services professionals. Emotional...Ch. 11 - Retaliation against company whistle-blowers....Ch. 11 - Extending the life of an aluminum smelter pot. An...Ch. 11 - Diamonds sold at retail. Refer to the Journal of...Ch. 11 - Sports news on local TV broadcasts. The Sports...Ch. 11 - Evaluating managerial success. An observational...Ch. 11 - Doctors and ethics. Refer to the Journal of...Ch. 11 - FCAT scores and poverty. In the state of Florida,...Ch. 11 - Monetary values of NFL teams. Refer to the Forbes...Ch. 11 - Evaluating a truck weigh-in-motion program. The...Ch. 11 - Energy efficiency of buildings. Firms conscious of...Ch. 11 - Forecasting managerial needs. Managers are an...Ch. 11 - Prob. 11.118ACACh. 11 - Prob. 11.119CTCCh. 11 - Prob. 11.120CTC
Knowledge Booster


Learn more about
Need a deep-dive on the concept behind this application? Look no further. Learn more about this topic, statistics and related others by exploring similar questions and additional content below.Similar questions
- A researcher wishes to estimate, with 90% confidence, the population proportion of adults who support labeling legislation for genetically modified organisms (GMOs). Her estimate must be accurate within 4% of the true proportion. (a) No preliminary estimate is available. Find the minimum sample size needed. (b) Find the minimum sample size needed, using a prior study that found that 65% of the respondents said they support labeling legislation for GMOs. (c) Compare the results from parts (a) and (b). ... (a) What is the minimum sample size needed assuming that no prior information is available? n = (Round up to the nearest whole number as needed.)arrow_forwardThe table available below shows the costs per mile (in cents) for a sample of automobiles. At a = 0.05, can you conclude that at least one mean cost per mile is different from the others? Click on the icon to view the data table. Let Hss, HMS, HLS, Hsuv and Hмy represent the mean costs per mile for small sedans, medium sedans, large sedans, SUV 4WDs, and minivans respectively. What are the hypotheses for this test? OA. Ho: Not all the means are equal. Ha Hss HMS HLS HSUV HMV B. Ho Hss HMS HLS HSUV = μMV Ha: Hss *HMS *HLS*HSUV * HMV C. Ho Hss HMS HLS HSUV =μMV = = H: Not all the means are equal. D. Ho Hss HMS HLS HSUV HMV Ha Hss HMS HLS =HSUV = HMVarrow_forwardQuestion: A company launches two different marketing campaigns to promote the same product in two different regions. After one month, the company collects the sales data (in units sold) from both regions to compare the effectiveness of the campaigns. The company wants to determine whether there is a significant difference in the mean sales between the two regions. Perform a two sample T-test You can provide your answer by inserting a text box and the answer must include: Null hypothesis, Alternative hypothesis, Show answer (output table/summary table), and Conclusion based on the P value. (2 points = 0.5 x 4 Answers) Each of these is worth 0.5 points. However, showing the calculation is must. If calculation is missing, the whole answer won't get any credit.arrow_forward
- Binomial Prob. Question: A new teaching method claims to improve student engagement. A survey reveals that 60% of students find this method engaging. If 15 students are randomly selected, what is the probability that: a) Exactly 9 students find the method engaging?b) At least 7 students find the method engaging? (2 points = 1 x 2 answers) Provide answers in the yellow cellsarrow_forwardIn a survey of 2273 adults, 739 say they believe in UFOS. Construct a 95% confidence interval for the population proportion of adults who believe in UFOs. A 95% confidence interval for the population proportion is ( ☐, ☐ ). (Round to three decimal places as needed.)arrow_forwardFind the minimum sample size n needed to estimate μ for the given values of c, σ, and E. C=0.98, σ 6.7, and E = 2 Assume that a preliminary sample has at least 30 members. n = (Round up to the nearest whole number.)arrow_forward
- In a survey of 2193 adults in a recent year, 1233 say they have made a New Year's resolution. Construct 90% and 95% confidence intervals for the population proportion. Interpret the results and compare the widths of the confidence intervals. The 90% confidence interval for the population proportion p is (Round to three decimal places as needed.) J.D) .arrow_forwardLet p be the population proportion for the following condition. Find the point estimates for p and q. In a survey of 1143 adults from country A, 317 said that they were not confident that the food they eat in country A is safe. The point estimate for p, p, is (Round to three decimal places as needed.) ...arrow_forward(c) Because logistic regression predicts probabilities of outcomes, observations used to build a logistic regression model need not be independent. A. false: all observations must be independent B. true C. false: only observations with the same outcome need to be independent I ANSWERED: A. false: all observations must be independent. (This was marked wrong but I have no idea why. Isn't this a basic assumption of logistic regression)arrow_forward
- Business discussarrow_forwardSpam filters are built on principles similar to those used in logistic regression. We fit a probability that each message is spam or not spam. We have several variables for each email. Here are a few: to_multiple=1 if there are multiple recipients, winner=1 if the word 'winner' appears in the subject line, format=1 if the email is poorly formatted, re_subj=1 if "re" appears in the subject line. A logistic model was fit to a dataset with the following output: Estimate SE Z Pr(>|Z|) (Intercept) -0.8161 0.086 -9.4895 0 to_multiple -2.5651 0.3052 -8.4047 0 winner 1.5801 0.3156 5.0067 0 format -0.1528 0.1136 -1.3451 0.1786 re_subj -2.8401 0.363 -7.824 0 (a) Write down the model using the coefficients from the model fit.log_odds(spam) = -0.8161 + -2.5651 + to_multiple + 1.5801 winner + -0.1528 format + -2.8401 re_subj(b) Suppose we have an observation where to_multiple=0, winner=1, format=0, and re_subj=0. What is the predicted probability that this message is spam?…arrow_forwardConsider an event X comprised of three outcomes whose probabilities are 9/18, 1/18,and 6/18. Compute the probability of the complement of the event. Question content area bottom Part 1 A.1/2 B.2/18 C.16/18 D.16/3arrow_forward
arrow_back_ios
SEE MORE QUESTIONS
arrow_forward_ios
Recommended textbooks for you
 Functions and Change: A Modeling Approach to Coll...AlgebraISBN:9781337111348Author:Bruce Crauder, Benny Evans, Alan NoellPublisher:Cengage Learning
 Holt Mcdougal Larson Pre-algebra: Student Edition...AlgebraISBN:9780547587776Author:HOLT MCDOUGALPublisher:HOLT MCDOUGAL
 Glencoe Algebra 1, Student Edition, 9780079039897...AlgebraISBN:9780079039897Author:CarterPublisher:McGraw Hill
 Trigonometry (MindTap Course List)TrigonometryISBN:9781337278461Author:Ron LarsonPublisher:Cengage Learning
 Linear Algebra: A Modern IntroductionAlgebraISBN:9781285463247Author:David PoolePublisher:Cengage Learning
Functions and Change: A Modeling Approach to Coll...
Algebra
ISBN:9781337111348
Author:Bruce Crauder, Benny Evans, Alan Noell
Publisher:Cengage Learning
Holt Mcdougal Larson Pre-algebra: Student Edition...
Algebra
ISBN:9780547587776
Author:HOLT MCDOUGAL
Publisher:HOLT MCDOUGAL
Glencoe Algebra 1, Student Edition, 9780079039897...
Algebra
ISBN:9780079039897
Author:Carter
Publisher:McGraw Hill
Trigonometry (MindTap Course List)
Trigonometry
ISBN:9781337278461
Author:Ron Larson
Publisher:Cengage Learning
Linear Algebra: A Modern Introduction
Algebra
ISBN:9781285463247
Author:David Poole
Publisher:Cengage Learning
Correlation Vs Regression: Difference Between them with definition & Comparison Chart; Author: Key Differences;https://www.youtube.com/watch?v=Ou2QGSJVd0U;License: Standard YouTube License, CC-BY
Correlation and Regression: Concepts with Illustrative examples; Author: LEARN & APPLY : Lean and Six Sigma;https://www.youtube.com/watch?v=xTpHD5WLuoA;License: Standard YouTube License, CC-BY