
Videos
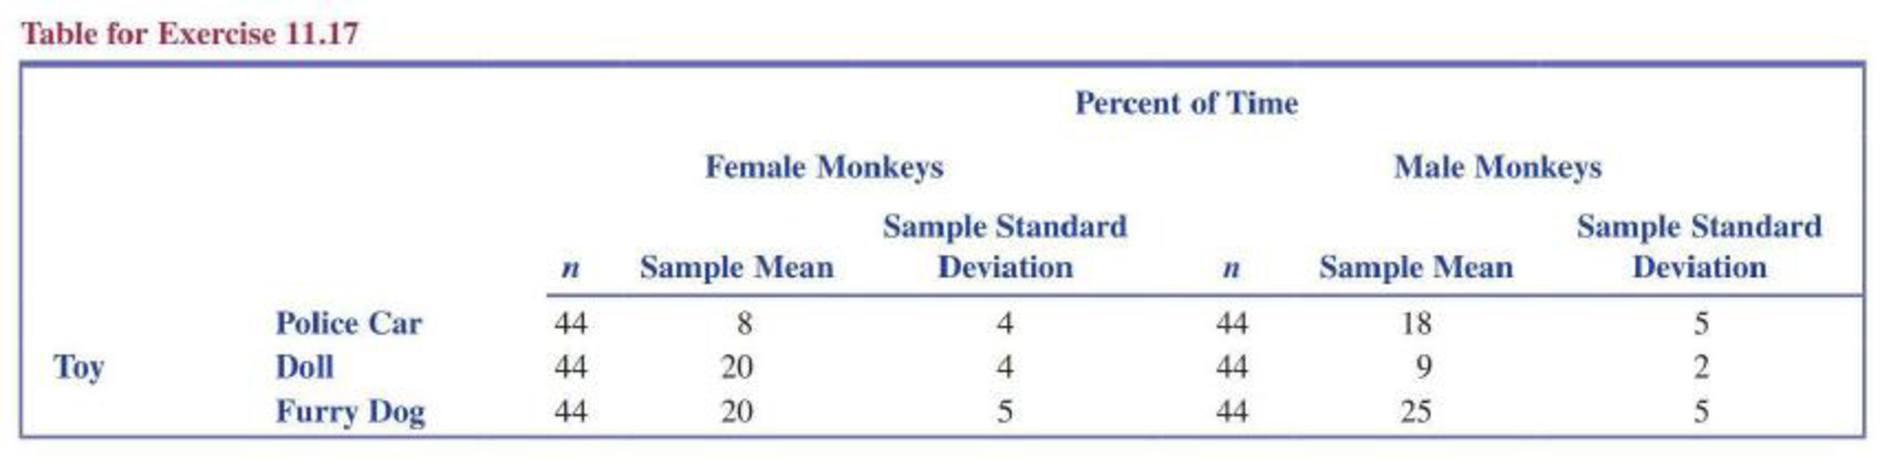
A newspaper story headline reads “Gender Plays Part in Monkeys’ Toy Choices, Research Finds—Like Humans, Male Monkeys Choose Balls and Cars, While Females Prefer Dolls and Pots” (Knight Ridder Newspapers, December 8, 2005). The article goes on to summarize findings published in the paper “Sex Differences in Response to Children’s Toys in Nonhuman Primates” (Evolution and Human Behavior [2002]: 467–479). Forty-four male monkeys and 44 female monkeys were each given a variety of toys, and the time spent playing with each toy was recorded. The table below gives means and standard deviations (approximate values read from graphs in the paper) for the percentage of time that a monkey spent playing with a particular toy. Assume that it is reasonable to regard these two samples of 44 monkeys as representative of the populations of male monkeys and female monkeys. Use a 0.05 significance level for any hypothesis tests that you carry out when answering the various parts of this exercise.
- a. The police car was considered a “masculine toy.” Do these data provide convincing evidence that the
mean percentage of the time spent playing with the police car is greater for male monkeys than for female monkeys? - b. The doll was considered a “feminine toy.” Do these data provide convincing evidence that the mean percentage of time spent playing with the doll is greater for female monkeys than for male monkeys?
- c. The furry dog was considered a “neutral toy.” Do these data provide convincing evidence that the mean percentage of time spent playing with the furry dog is not the same for male and female monkeys?
- d. Based on the conclusions from the hypothesis tests of Parts (a)–(c), is the quoted newspaper story headline a reasonable summary of the findings? Explain.
- e. Explain why it would be inappropriate to use the two-sample t test to decide if there was evidence that the mean percentage of time spent playing with the police car and the mean percentage of the time spent playing with the doll is not the same for female monkeys.
a.
Check whether mean percentage of time spent playing with police car is greater for male monkeys than for female monkeys or not.
Answer to Problem 17E
There is convincing evidence that mean percentage of time spent playing with police car is greater for male monkeys than for female monkeys.
Explanation of Solution
Calculation:
Given table provides the percentage of time spent playing with toys.
The assumptions for the two-sample t-test:
- The random samples should be collected independently.
- The sample sizes should be large. That is, each sample size is at least 30.
The assumptions in this particular problem:
- Two samples of 44 monkeys are selected randomly and independently from the population.
- The sample sizes are large enough.
Here, both sample sizes are equal to 44 and which are greater than 30.
Therefore, the assumptions are satisfied.
Let
Let
Hypotheses:
Null hypothesis:
That is, the mean percentage of time playing with police car is same for both male and female monkeys.
Alternative hypothesis:
That is, the mean percentage of time spent playing with police car is greater for male monkeys than for female monkeys.
Test statistic and P-value:
Software procedure:
Step by step procedure to obtain the P-value and test statistic by using MINITAB software is as follows:
- Choose Stat > Basic Statistics > 2 sample t.
- Choose Summarized data.
- In sample 1, enter Sample size as 44, Mean as 18, Standard deviation as 5.
- In sample 2, enter Sample size as 44, Mean as 8, Standard deviation as 4.
- Choose Options.
- In Confidence level, enter 95.
- In Alternative, select greater than.
- Click OK in all the dialogue boxes.
Output using the MINITAB software is given below:
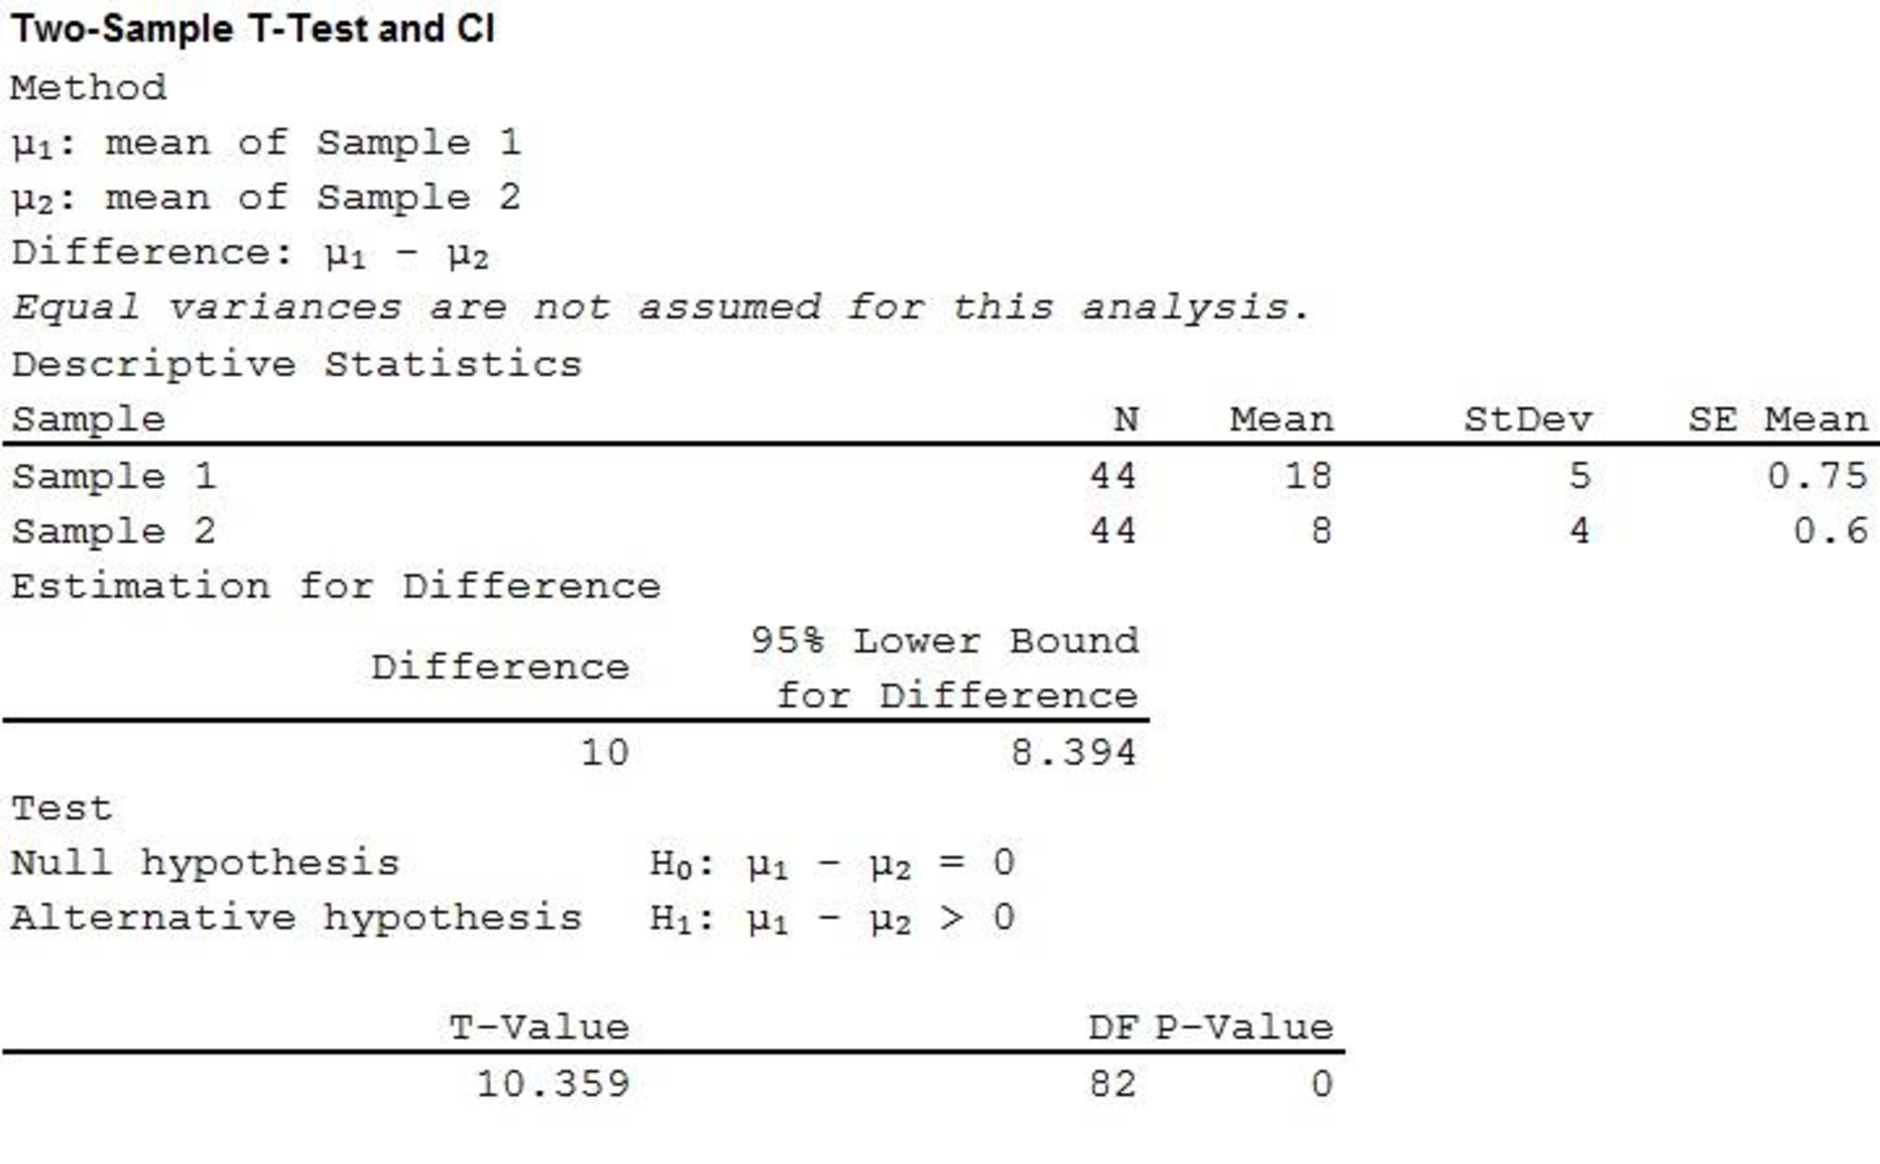
Therefore, the P-value is 0 and the test statistic is 10.359.
Decision rule:
- If P-value is less than or equal to the level of significance, reject the null hypothesis.
- Otherwise fail to reject the null hypothesis.
Conclusion:
Here, the level of significance is 0.05.
Here, P-value is less than the level of significance.
That is,
Therefore, reject the null hypothesis.
Hence, there is proper evidence to support the claim that the mean percentage of time spent playing with police car is greater for male monkeys than for female monkeys.
b.
Check whether mean percentage of time spent playing with doll is greater for female monkeys than for male monkeys or not.
Answer to Problem 17E
There is convincing evidence that mean percentage of time spent playing with doll is greater for female monkeys than for male monkeys.
Explanation of Solution
Calculation:
The assumption for the two-sample t-test:
- The random samples should be collected independently.
- The sample sizes should be large. That is, each sample size is at least 30.
The assumptions in this particular problem:
- Two samples of 44 monkeys are selected randomly and independently from the population.
- The sample sizes are large enough.
Here, both sample sizes are equal to 44 and which are greater than 30.
Therefore, the assumptions are satisfied.
Let
Let
Hypotheses:
Null hypothesis:
That is, the mean percentage of time playing with doll is same for both male and female monkeys.
Alternative hypothesis:
That is, the mean percentage of time spent playing with doll is greater for female monkeys than for male monkeys.
Test statistic and P-value:
Software procedure:
Step by step procedure to obtain the P-value and test statistic by using MINITAB software is as follows:
- Choose Stat > Basic Statistics > 2 sample t.
- Choose Summarized data.
- In sample 1, enter Sample size as 44, Mean as 9, Standard deviation as 2.
- In sample 2, enter Sample size as 44, Mean as 20, Standard deviation as 4.
- Choose Options.
- In Confidence level, enter 95.
- In Alternative, select less than.
- Click OK in all the dialogue boxes.
Output using the MINITAB software is given below:
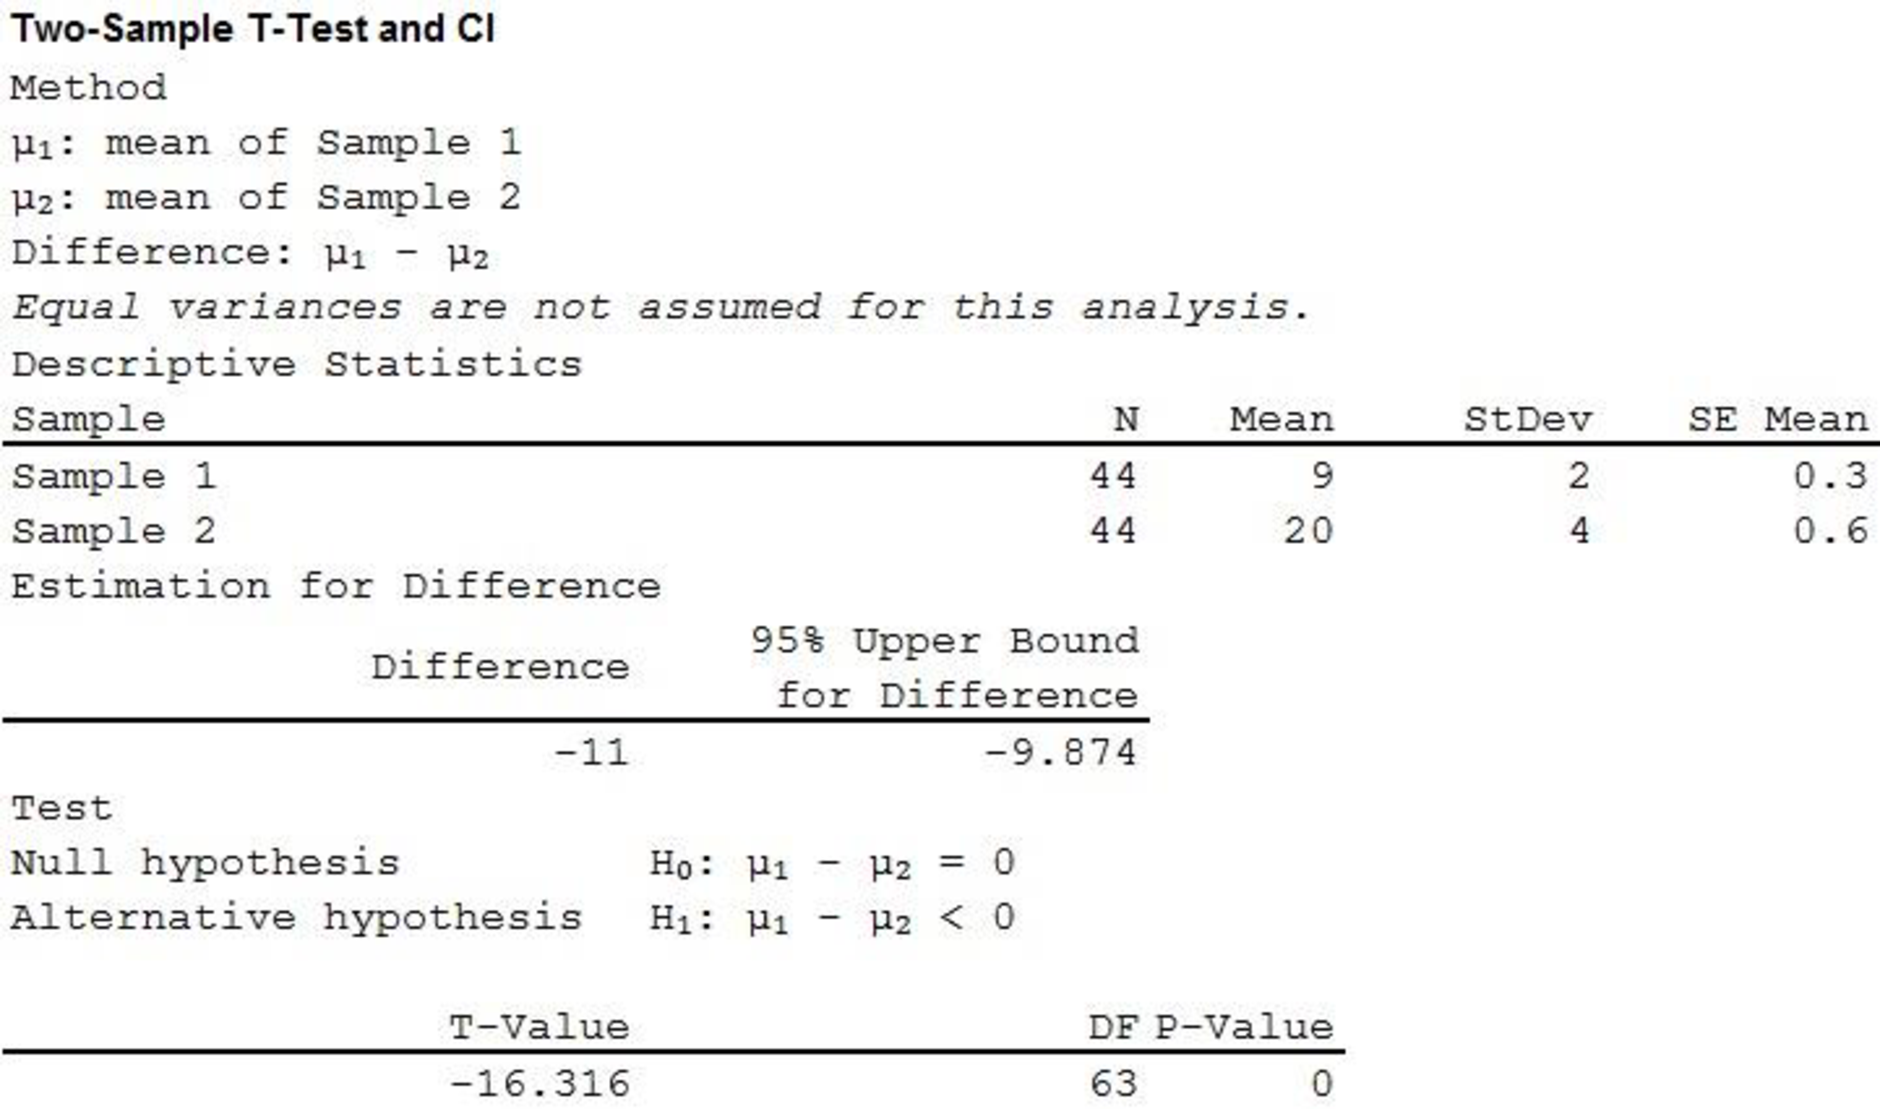
Therefore, the P-value is 0 and the test statistic is –16.316.
Decision rule:
- If P-value is less than or equal to the level of significance, reject the null hypothesis.
- Otherwise fail to reject the null hypothesis.
Conclusion:
Here, the level of significance is 0.05.
Here, P-value is less than the level of significance.
That is,
Therefore, reject the null hypothesis.
Hence, there is proper evidence to support the claim that the mean percentage of time spent playing with doll is greater for female monkeys than for male monkeys.
c.
Check whether mean percentage of time spent playing with furry dog is not the same for female and male monkeys or not.
Answer to Problem 17E
There is convincing evidence that mean percentage of time spent playing with furry dog is not the same for female and male monkeys.
Explanation of Solution
Calculation:
The assumption for the two-sample t-test:
- The random samples should be collected independently.
- The sample sizes should be large. That is, each sample size is at least 30.
The assumptions in this particular problem:
- Two samples of 44 monkeys are selected randomly and independently from the population.
- The sample sizes are large enough.
Here, both sample sizes are equal to 44 and which are greater than 30.
Therefore, the assumptions are satisfied.
Let
Let
Hypotheses:
Null hypothesis:
That is, the mean percentage of time playing with furry dog is same for both male and female monkeys.
Alternative hypothesis:
That is, the mean percentage of time spent playing with furry dog is not the same for female and male monkeys.
Test statistic and P-value:
Software procedure:
Step by step procedure to obtain the P-value and test statistic by using MINITAB software is as follows:
- Choose Stat > Basic Statistics > 2 sample t.
- Choose Summarized data.
- In sample 1, enter Sample size as 44, Mean as 25, Standard deviation as 5.
- In sample 2, enter Sample size as 44, Mean as 20, Standard deviation as 5.
- Choose Options.
- In Confidence level, enter 95.
- In Alternative, select not equal.
- Click OK in all the dialogue boxes.
Output using the MINITAB software is given below:
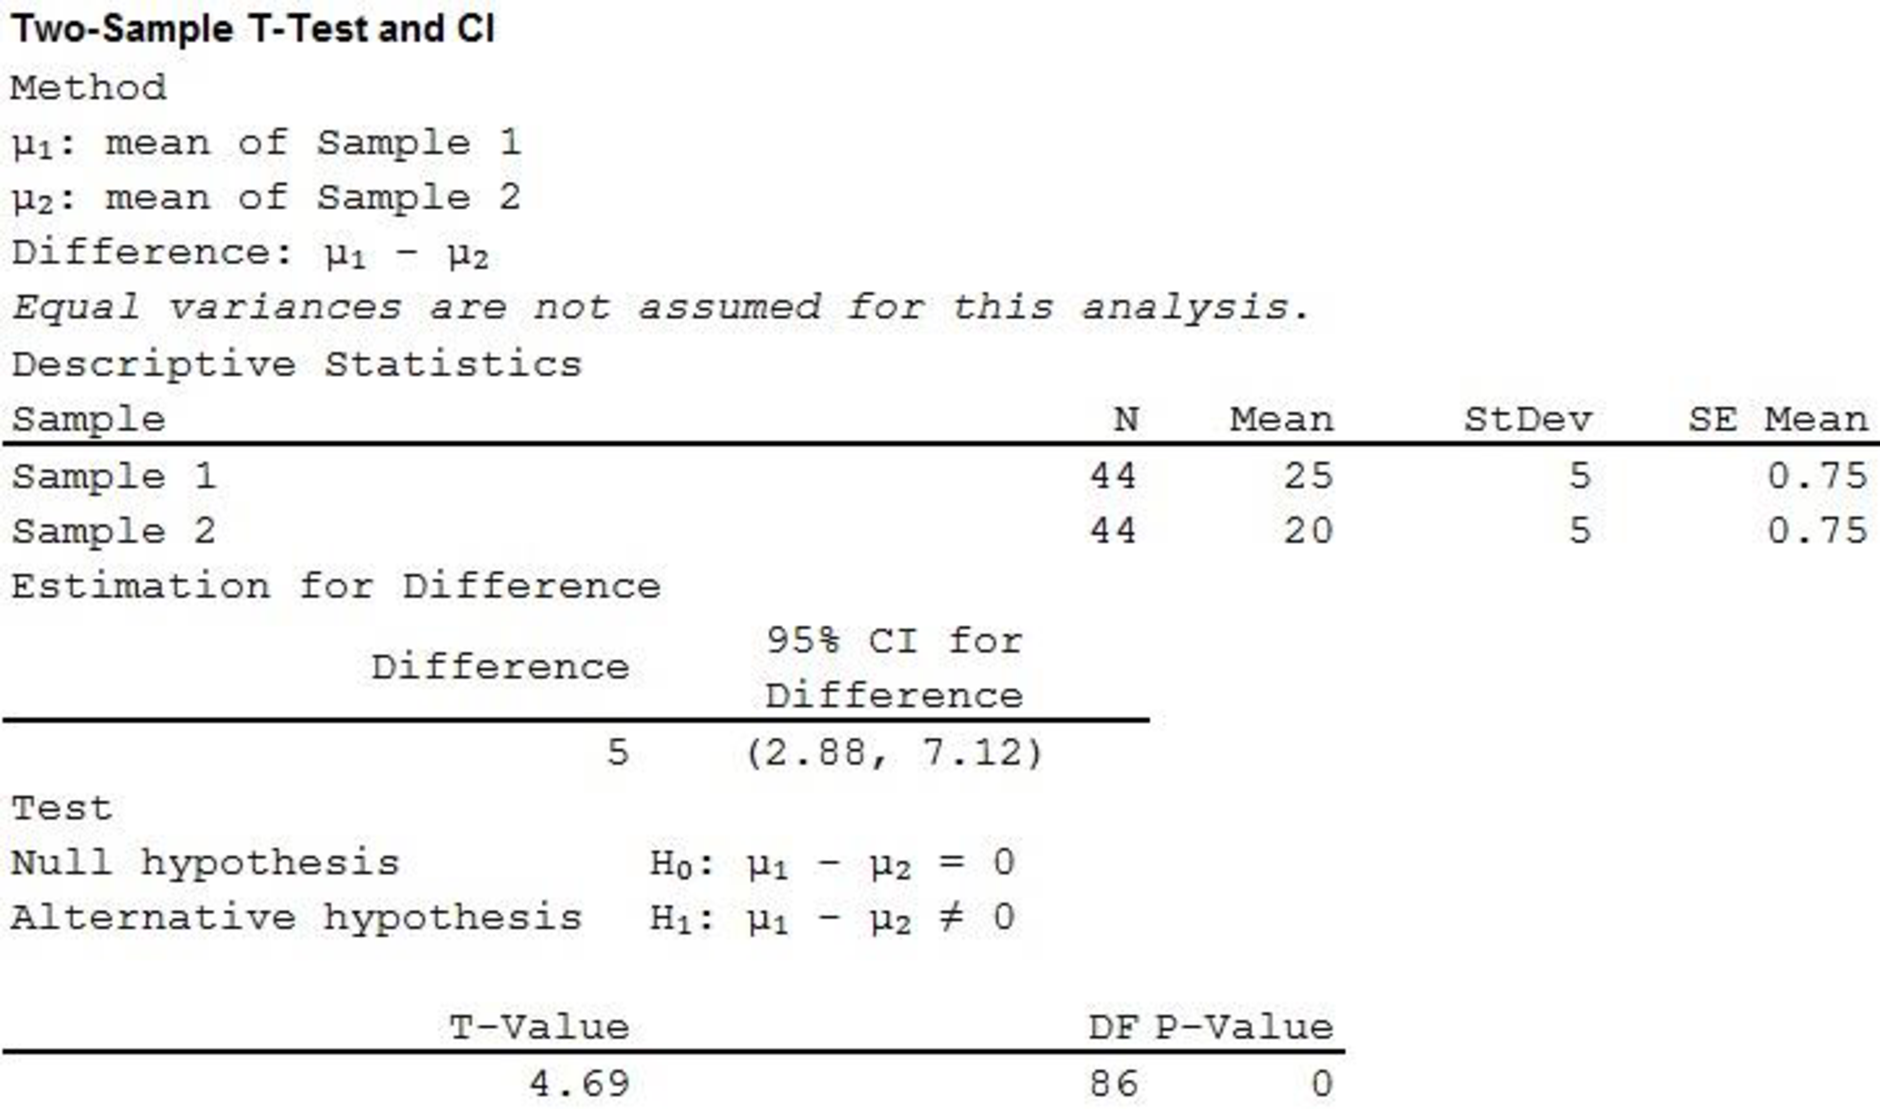
Therefore, the P-value is 0 and the test statistic is 4.690.
Decision rule:
- If P-value is less than or equal to the level of significance, reject the null hypothesis.
- Otherwise fail to reject the null hypothesis.
Conclusion:
Here, the level of significance is 0.05.
Here, P-value is less than the level of significance.
That is,
Therefore, reject the null hypothesis.
Hence, there is proper evidence to support the claim that the mean percentage of time spent playing with furry dog is not the same for female and male monkeys.
d.
Explain whether the newspaper head line a reasonable summary of the findings.
Explanation of Solution
From parts (a), (b), and (c), it is clear that, the male monkeys spent more time with masculine toy than female monkeys, the female monkeys spent more time with feminine toy than male monkeys, mean percentage of time spent playing with neutral toy is not same for female and male monkeys. Therefore the result shows convincing evidence of a gender basis in the monkeys’ choice of how much time to spend playing with three of the toys.
e.
Explain why two sample t test is inappropriate in this situation.
Explanation of Solution
Here, the population under consideration is female monkeys. The mean percentage of time spent playing with the police car and mean time spent playing with the doll is not same for the population. That is samples are taken from the same population. That is, samples are dependent. Two sample t test is appropriate only when samples are independent. Therefore, two sample t test is inappropriate in this situation.
Want to see more full solutions like this?
Chapter 11 Solutions
Introduction to Statistics and Data Analysis


- 38. Possible values of X, the number of components in a system submitted for repair that must be replaced, are 1, 2, 3, and 4 with corresponding probabilities .15, .35, .35, and .15, respectively. a. Calculate E(X) and then E(5 - X).b. Would the repair facility be better off charging a flat fee of $75 or else the amount $[150/(5 - X)]? [Note: It is not generally true that E(c/Y) = c/E(Y).]arrow_forward74. The proportions of blood phenotypes in the U.S. popula- tion are as follows:A B AB O .40 .11 .04 .45 Assuming that the phenotypes of two randomly selected individuals are independent of one another, what is the probability that both phenotypes are O? What is the probability that the phenotypes of two randomly selected individuals match?arrow_forward53. A certain shop repairs both audio and video compo- nents. Let A denote the event that the next component brought in for repair is an audio component, and let B be the event that the next component is a compact disc player (so the event B is contained in A). Suppose that P(A) = .6 and P(B) = .05. What is P(BA)?arrow_forward
- 26. A certain system can experience three different types of defects. Let A;(i = 1,2,3) denote the event that the sys- tem has a defect of type i. Suppose thatP(A1) = .12 P(A) = .07 P(A) = .05P(A, U A2) = .13P(A, U A3) = .14P(A2 U A3) = .10P(A, A2 A3) = .011Rshelfa. What is the probability that the system does not havea type 1 defect?b. What is the probability that the system has both type 1 and type 2 defects?c. What is the probability that the system has both type 1 and type 2 defects but not a type 3 defect? d. What is the probability that the system has at most two of these defects?arrow_forwardThe following are suggested designs for group sequential studies. Using PROCSEQDESIGN, provide the following for the design O’Brien Fleming and Pocock.• The critical boundary values for each analysis of the data• The expected sample sizes at each interim analysisAssume the standardized Z score method for calculating boundaries.Investigators are evaluating the success rate of a novel drug for treating a certain type ofbacterial wound infection. Since no existing treatment exists, they have planned a one-armstudy. They wish to test whether the success rate of the drug is better than 50%, whichthey have defined as the null success rate. Preliminary testing has estimated the successrate of the drug at 55%. The investigators are eager to get the drug into production andwould like to plan for 9 interim analyses (10 analyzes in total) of the data. Assume thesignificance level is 5% and power is 90%.Besides, draw a combined boundary plot (OBF, POC, and HP)arrow_forwardPlease provide the solution for the attached image in detailed.arrow_forward
- 20 km, because GISS Worksheet 10 Jesse runs a small business selling and delivering mealie meal to the spaza shops. He charges a fixed rate of R80, 00 for delivery and then R15, 50 for each packet of mealle meal he delivers. The table below helps him to calculate what to charge his customers. 10 20 30 40 50 Packets of mealie meal (m) Total costs in Rands 80 235 390 545 700 855 (c) 10.1. Define the following terms: 10.1.1. Independent Variables 10.1.2. Dependent Variables 10.2. 10.3. 10.4. 10.5. Determine the independent and dependent variables. Are the variables in this scenario discrete or continuous values? Explain What shape do you expect the graph to be? Why? Draw a graph on the graph provided to represent the information in the table above. TOTAL COST OF PACKETS OF MEALIE MEAL 900 800 700 600 COST (R) 500 400 300 200 100 0 10 20 30 40 60 NUMBER OF PACKETS OF MEALIE MEALarrow_forwardLet X be a random variable with support SX = {−3, 0.5, 3, −2.5, 3.5}. Part ofits probability mass function (PMF) is given bypX(−3) = 0.15, pX(−2.5) = 0.3, pX(3) = 0.2, pX(3.5) = 0.15.(a) Find pX(0.5).(b) Find the cumulative distribution function (CDF), FX(x), of X.1(c) Sketch the graph of FX(x).arrow_forwardA well-known company predominantly makes flat pack furniture for students. Variability with the automated machinery means the wood components are cut with a standard deviation in length of 0.45 mm. After they are cut the components are measured. If their length is more than 1.2 mm from the required length, the components are rejected. a) Calculate the percentage of components that get rejected. b) In a manufacturing run of 1000 units, how many are expected to be rejected? c) The company wishes to install more accurate equipment in order to reduce the rejection rate by one-half, using the same ±1.2mm rejection criterion. Calculate the maximum acceptable standard deviation of the new process.arrow_forward
- 5. Let X and Y be independent random variables and let the superscripts denote symmetrization (recall Sect. 3.6). Show that (X + Y) X+ys.arrow_forward8. Suppose that the moments of the random variable X are constant, that is, suppose that EX" =c for all n ≥ 1, for some constant c. Find the distribution of X.arrow_forward9. The concentration function of a random variable X is defined as Qx(h) = sup P(x ≤ X ≤x+h), h>0. Show that, if X and Y are independent random variables, then Qx+y (h) min{Qx(h). Qr (h)).arrow_forward
 Holt Mcdougal Larson Pre-algebra: Student Edition...AlgebraISBN:9780547587776Author:HOLT MCDOUGALPublisher:HOLT MCDOUGAL
 College Algebra (MindTap Course List)AlgebraISBN:9781305652231Author:R. David Gustafson, Jeff HughesPublisher:Cengage Learning
 Glencoe Algebra 1, Student Edition, 9780079039897...AlgebraISBN:9780079039897Author:CarterPublisher:McGraw Hill