Earlier in this section, we looked at the parametric equations for a cycloid, which is the path a point on the edge of a wheel traces as the wheel rolls along a straight path. In this project we look at two different variations of the cycloid. called the curtate and prolate cycloids.
First. let’s revisit the derivation of the parametric equations for a cycloid. Recall that we considered a tenacious ant trying to get home by hanging onto the edge of a bicycle tire. We have assumed the ant climbed onto the tire at the very edge, where the tire touches the ground. As the wheel rolls, the ant moves with the edge of the tire (Figure 1.13).
As we have discussed, we have a lot of flexibility when parameterizing a curve. In this case we let our parameter c represent the angle the tire has rotated through. Looking at Figure 1.13, we see that after the tire has rotated through an angle of t, the Position of the center of the wheel,
Furthermore, letting
Then
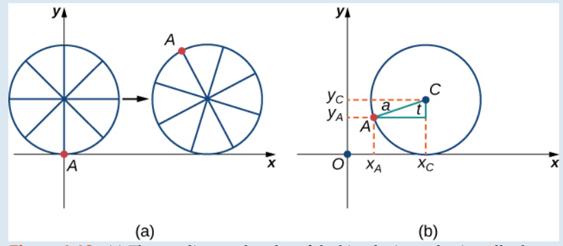
Figure 1.13 (a) The ant clings to die edge of the bicycle tile as the tire rolls along the ground. (b) Using geometry to determine the position of the ant after the tire has rotated through an angle of t.
Note that these are the same parametric representations we had before, but we have now assigned a physical meaning to the parametric variable t.
After a while the am is getting dizzy from going round and round on the edge of the tire. So he climbs up one of the spokes toward the center of the wheel. By climbing toward the center of the wheel. the ant has changed his path of motion. The new path has less up-and-down motion and is called a mutate cycloid (Figure 1.14). As shown in the figure. we let b denote the distance along the spoke flow the center of the wheel to the ant. As before, we let t represent the angle the fire has rotated through. Additionally, we let
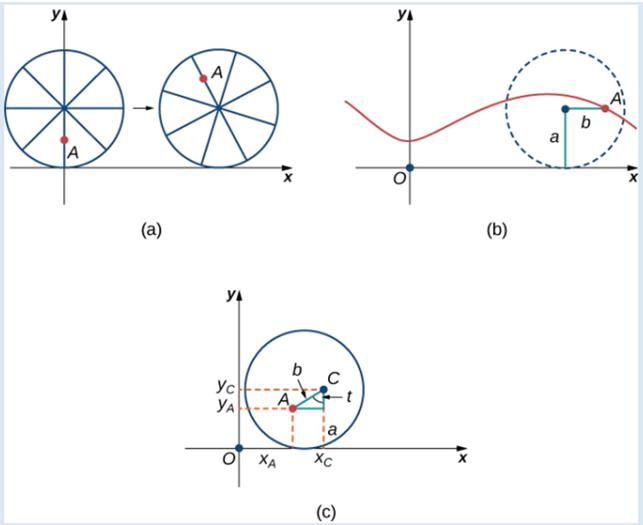
Figure 1.14 (a) The ant climbs up one of the spokes toward the center of the wheel. (b) The ant's path of motion after he climbs closer to the center of the wheel. This is called a mutate cycloid. (c) The new Setup, now that the ant has moved closer to the center of the wheel.
5. What do you notice about your answer to pan 3 and your answer to part 4?
Notice that the ant is actually traveling backward at times (the “loops” in the graph), even though the train continues to move forward. He is probably going to be really dizzy by the time he gets home!
Want to see the full answer?
Check out a sample textbook solution
Chapter 1 Solutions
Calculus Volume 3
Additional Math Textbook Solutions
University Calculus: Early Transcendentals (4th Edition)
Elementary Statistics: Picturing the World (7th Edition)
A First Course in Probability (10th Edition)
A Problem Solving Approach To Mathematics For Elementary School Teachers (13th Edition)
Calculus: Early Transcendentals (2nd Edition)

- BUSINESS DISCUSSarrow_forwarda -> f(x) = f(x) = [x] show that whether f is continuous function or not(by using theorem) Muslim_mathsarrow_forwardUse Green's Theorem to evaluate F. dr, where F = (√+4y, 2x + √√) and C consists of the arc of the curve y = 4x - x² from (0,0) to (4,0) and the line segment from (4,0) to (0,0).arrow_forward
- When a tennis player serves, he gets two chances to serve in bounds. If he fails to do so twice, he loses the point. If he attempts to serve an ace, he serves in bounds with probability 3/8.If he serves a lob, he serves in bounds with probability 7/8. If he serves an ace in bounds, he wins the point with probability 2/3. With an in-bounds lob, he wins the point with probability 1/3. If the cost is '+1' for each point lost and '-1' for each point won, the problem is to determine the optimal serving strategy to minimize the (long-run)expected average cost per point. (Hint: Let state 0 denote point over,two serves to go on next point; and let state 1 denote one serve left. (1). Formulate this problem as a Markov decision process by identifying the states and decisions and then finding the Cik. (2). Draw the corresponding state action diagram. (3). List all possible (stationary deterministic) policies. (4). For each policy, find the transition matrix and write an expression for the…arrow_forwardDuring each time period, a potential customer arrives at a restaurant with probability 1/2. If there are already two people at the restaurant (including the one being served), the potential customer leaves the restaurant immediately and never returns. However, if there is one person or less, he enters the restaurant and becomes an actual customer. The manager has two types of service configurations available. At the beginning of each period, a decision must be made on which configuration to use. If she uses her "slow" configuration at a cost of $3 and any customers are present during the period, one customer will be served and leave with probability 3/5. If she uses her "fast" configuration at a cost of $9 and any customers are present during the period, one customer will be served and leave with probability 4/5. The probability of more than one customer arriving or more than one customer being served in a period is zero. A profit of $50 is earned when a customer is served. The manager…arrow_forwardEvery Saturday night a man plays poker at his home with the same group of friends. If he provides refreshments for the group (at an expected cost of $14) on any given Saturday night, the group will begin the following Saturday night in a good mood with probability 7/8 and in a bad mood with probability 1/8. However, if he fail to provide refreshments, the group will begin the following Saturday night in a good mood with probability 1/8 and in a bad mood with probability 7/8 regardless of their mood this Saturday. Furthermore, if the group begins the night in a bad mood and then he fails to provide refreshments, the group will gang up on him so that he incurs expected poker losses of $75. Under other circumstances he averages no gain or loss on his poker play. The man wishes to find the policy regarding when to provide refreshments that will minimize his (long-run) expected average cost per week. (1). Formulate this problem as a Markov decision process by identifying the states and…arrow_forward
- This year Amanda decides to invest in two different no-load mutual funds: the G Fund or the L Mutual Fund. At the end of each year, she liquidates her holdings, takes her profits, and then reinvests. The yearly profits of the mutual funds depend on where the market stood at the end of the preceding year. Recently the market has been oscillating around level 2 from one year end to the next, according to the probabilities given in the following transition matrix : L1 L2 L3 L1 0.2 0.4 0.4 L2 0.1 0.4 0.5 L3 0.3 0.3 0.4 Each year that the market moves up (down) 1 level, the G Fund has profits (losses) of $20k, while the L Fund has profits (losses) of $10k. If the market moves up (down) 2 level in a year, the G Fund has profits (losses) of $50k, while the L Fund has profits (losses) of only $20k. If the market does not change, there is no profit or loss for either fund. Amanda wishes to determine her optimal investment policy in order to maximize her (long-run) expected average profit per…arrow_forwardEvaluate F. dr where F(x, y, z) = (2yz cos(xyz), 2xzcos(xyz), 2xy cos(xyz)) and C is the line π 1 1 segment starting at the point (8, ' and ending at the point (3, 2 3'6arrow_forwardSolve this questions pleasearrow_forward
- Find all positive integers n such that n.2n +1 is a square.arrow_forwardA researcher wishes to estimate, with 90% confidence, the population proportion of adults who support labeling legislation for genetically modified organisms (GMOs). Her estimate must be accurate within 4% of the true proportion. (a) No preliminary estimate is available. Find the minimum sample size needed. (b) Find the minimum sample size needed, using a prior study that found that 65% of the respondents said they support labeling legislation for GMOs. (c) Compare the results from parts (a) and (b). ... (a) What is the minimum sample size needed assuming that no prior information is available? n = (Round up to the nearest whole number as needed.)arrow_forwardThe table available below shows the costs per mile (in cents) for a sample of automobiles. At a = 0.05, can you conclude that at least one mean cost per mile is different from the others? Click on the icon to view the data table. Let Hss, HMS, HLS, Hsuv and Hмy represent the mean costs per mile for small sedans, medium sedans, large sedans, SUV 4WDs, and minivans respectively. What are the hypotheses for this test? OA. Ho: Not all the means are equal. Ha Hss HMS HLS HSUV HMV B. Ho Hss HMS HLS HSUV = μMV Ha: Hss *HMS *HLS*HSUV * HMV C. Ho Hss HMS HLS HSUV =μMV = = H: Not all the means are equal. D. Ho Hss HMS HLS HSUV HMV Ha Hss HMS HLS =HSUV = HMVarrow_forward
 Algebra & Trigonometry with Analytic GeometryAlgebraISBN:9781133382119Author:SwokowskiPublisher:Cengage
 Trigonometry (MindTap Course List)TrigonometryISBN:9781337278461Author:Ron LarsonPublisher:Cengage Learning
 Algebra and Trigonometry (MindTap Course List)AlgebraISBN:9781305071742Author:James Stewart, Lothar Redlin, Saleem WatsonPublisher:Cengage Learning
 Holt Mcdougal Larson Pre-algebra: Student Edition...AlgebraISBN:9780547587776Author:HOLT MCDOUGALPublisher:HOLT MCDOUGAL