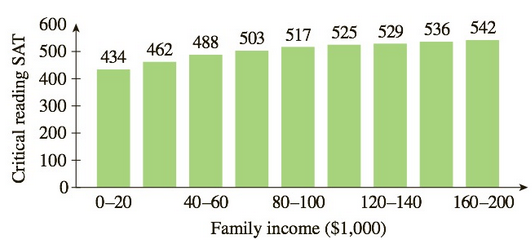
SAT Scores by Income The following bar graph shows U.S. critical reading SAT scores as a function of household income: These data can be modeled by S ( x ) = 550 − 136 e − 0.0151 x where S ( x ) is the average math SAT score of students whose household income is x thousand dollars per year. Calculate lim x → + ∞ S ( x ) , and interpret the answer.
SAT Scores by Income The following bar graph shows U.S. critical reading SAT scores as a function of household income: These data can be modeled by S ( x ) = 550 − 136 e − 0.0151 x where S ( x ) is the average math SAT score of students whose household income is x thousand dollars per year. Calculate lim x → + ∞ S ( x ) , and interpret the answer.
Solution Summary: The author calculates the value of the function, S(x)=550-136e-0.0151x, and the bar graph of math SAT scores as a function of household income.
SAT Scores by Income The following bar graph shows U.S. critical reading SAT scores as a function of household income:
These data can be modeled by
S
(
x
)
=
550
−
136
e
−
0.0151
x
where
S
(
x
)
is the average math SAT score of students whose household income is x thousand dollars per year. Calculate
lim
x
→
+
∞
S
(
x
)
, and interpret the answer.
I circled the correct, could you explain using stoke
Use Euler's method to numerically integrate
dy
dx
-2x+12x² - 20x +8.5
from x=0 to x=4 with a step size of 0.5. The initial condition at x=0 is y=1. Recall
that the exact solution is given by y = -0.5x+4x³- 10x² + 8.5x+1
Find an equation of the line tangent to the graph of f(x) = (5x-9)(x+4) at (2,6).
Chapter 10 Solutions
Finite Mathematics and Applied Calculus (MindTap Course List)
Need a deep-dive on the concept behind this application? Look no further. Learn more about this topic, calculus and related others by exploring similar questions and additional content below.


 Elementary Linear Algebra (MindTap Course List)AlgebraISBN:9781305658004Author:Ron LarsonPublisher:Cengage Learning
 Algebra & Trigonometry with Analytic GeometryAlgebraISBN:9781133382119Author:SwokowskiPublisher:Cengage
 Glencoe Algebra 1, Student Edition, 9780079039897...AlgebraISBN:9780079039897Author:CarterPublisher:McGraw Hill
 Trigonometry (MindTap Course List)TrigonometryISBN:9781337278461Author:Ron LarsonPublisher:Cengage Learning