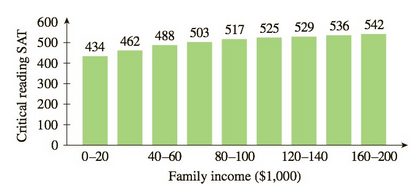
SAT Scores by Income The following bar graph shows U.S. critical reading SAT scores as a function of household income: 9 These data can be modeled by S ( x ) = 550 − 136 ( 0.985 ) x , where S ( x ) is the average critical reading SAT score of students whose household income is x thousand dollar per year. Numerically estimate lim x → + ∞ S ( x ) , and interpret the answer.
SAT Scores by Income The following bar graph shows U.S. critical reading SAT scores as a function of household income: 9 These data can be modeled by S ( x ) = 550 − 136 ( 0.985 ) x , where S ( x ) is the average critical reading SAT score of students whose household income is x thousand dollar per year. Numerically estimate lim x → + ∞ S ( x ) , and interpret the answer.
Solution Summary: The author calculates the value of undersetxto +infty
SAT Scores by Income The following bar graph shows U.S. critical reading SAT scores as a function of household income:9
These data can be modeled by
S
(
x
)
=
550
−
136
(
0.985
)
x
,
where
S
(
x
)
is the average critical reading SAT score of students whose household income is x thousand dollar per year. Numerically estimate
lim
x
→
+
∞
S
(
x
)
,
and interpret the answer.
Need a deep-dive on the concept behind this application? Look no further. Learn more about this topic, calculus and related others by exploring similar questions and additional content below.


 Algebra & Trigonometry with Analytic GeometryAlgebraISBN:9781133382119Author:SwokowskiPublisher:Cengage
 Elementary Linear Algebra (MindTap Course List)AlgebraISBN:9781305658004Author:Ron LarsonPublisher:Cengage Learning
 Trigonometry (MindTap Course List)TrigonometryISBN:9781337278461Author:Ron LarsonPublisher:Cengage Learning
 Glencoe Algebra 1, Student Edition, 9780079039897...AlgebraISBN:9780079039897Author:CarterPublisher:McGraw Hill