
Videos
Many people mistakenly believe that the seasons are caused by the earth’s varying proximity to the sun. In fact, the distance from the earth to the sun varies only slightly during the year, and the seasons are caused by the tilt of the earth's axis. As the earth travels around the sun during the year, the tilt of the earth's axis causes the northern hemisphere to vary between being tilted toward the sun to being tilted away from the sun. Figure 10.50 shows the earth as seen at a certain time of year from a point in outer space located in the plane in which the earth rotates about the sun. The diagram shows that the earth's axis is tilted 23.5° from the perpendicular to the plane in which the earth rotates around the sun. Throughout this problem, assume that the sun rays are parallel to the plane of the page.
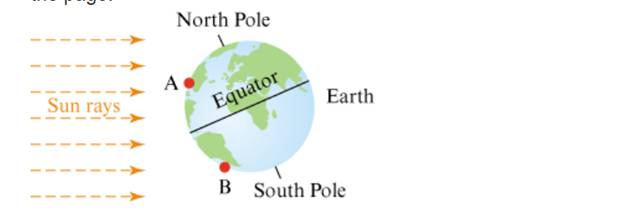
Figure 10.50 Earth and sun.
- Locations A and B in Figure 10.50 are shown at noon. Is the sun higher in the sky at noon at location A or at location B? Explain how you can tell.
- During the day, locations A and B will rotate around the axis through the North and South Poles. Compare the amount of sunlight that locations A and B will receive throughout the day. Which location will receive more sunlight during the day?
- Based on your answers to parts (a) and (b), what season is it in the northern hemisphere. and what season is it in the southern hemisphere in Figure 10.50 Explain.
- At another time of year, the earth and sun are positioned as shown in Figure 10.51 . At that time, what season is it in the northern and southern hemispheres? Why
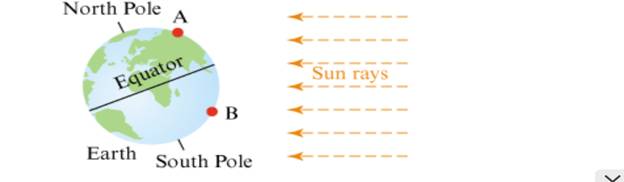
Flgure 10.51 Earth and sun at another time of year.
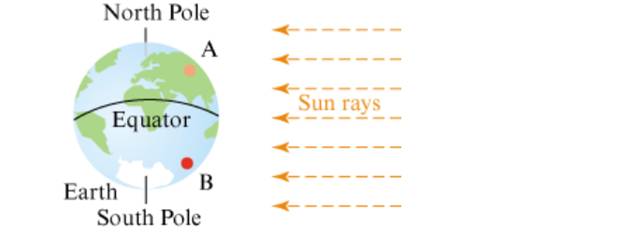
Figure 10.52 Earth and sun at another time of year.
Want to see the full answer?
Check out a sample textbook solution
Chapter 10 Solutions
EBK MATHEMATICS FOR ELEMENTARY TEACHERS
Additional Math Textbook Solutions
Elementary Statistics Using The Ti-83/84 Plus Calculator, Books A La Carte Edition (5th Edition)
Pathways To Math Literacy (looseleaf)
Elementary Statistics: A Step By Step Approach
APPLIED STAT.IN BUS.+ECONOMICS
Finite Mathematics for Business, Economics, Life Sciences and Social Sciences
Precalculus: Mathematics for Calculus (Standalone Book)


- Assignment Brief: 1. Use the trapezium rule with five ordinates (four strips) to find an approximation to giving your answer to 2 decimal places. 1 dx x³ +3arrow_forward59. At a certain gas station, 40% of the customers use regular gas (A1), 35% use plus gas (A2), and 25% use premium (A3). Of those customers using regular gas, only 30% fill their tanks (event B). Of those customers using plus, 60% fill their tanks, whereas of those using premium, 50% fill their tanks.a. What is the probability that the next customer will request plus gas and fill the tank (A2 B)?b. What is the probability that the next customer fills the tank?c. If the next customer fills the tank, what is the probability that regular gas is requested? Plus? Premium?arrow_forward38. Possible values of X, the number of components in a system submitted for repair that must be replaced, are 1, 2, 3, and 4 with corresponding probabilities .15, .35, .35, and .15, respectively. a. Calculate E(X) and then E(5 - X).b. Would the repair facility be better off charging a flat fee of $75 or else the amount $[150/(5 - X)]? [Note: It is not generally true that E(c/Y) = c/E(Y).]arrow_forward
- 74. The proportions of blood phenotypes in the U.S. popula- tion are as follows:A B AB O .40 .11 .04 .45 Assuming that the phenotypes of two randomly selected individuals are independent of one another, what is the probability that both phenotypes are O? What is the probability that the phenotypes of two randomly selected individuals match?arrow_forwardIf 50 is 10% of 500 lanterns, what percent is 100 out of 500 lanterns?arrow_forwardwhat is 4m-1? m=3arrow_forward
- 53. A certain shop repairs both audio and video compo- nents. Let A denote the event that the next component brought in for repair is an audio component, and let B be the event that the next component is a compact disc player (so the event B is contained in A). Suppose that P(A) = .6 and P(B) = .05. What is P(BA)?arrow_forward26. A certain system can experience three different types of defects. Let A;(i = 1,2,3) denote the event that the sys- tem has a defect of type i. Suppose thatP(A1) = .12 P(A) = .07 P(A) = .05P(A, U A2) = .13P(A, U A3) = .14P(A2 U A3) = .10P(A, A2 A3) = .011Rshelfa. What is the probability that the system does not havea type 1 defect?b. What is the probability that the system has both type 1 and type 2 defects?c. What is the probability that the system has both type 1 and type 2 defects but not a type 3 defect? d. What is the probability that the system has at most two of these defects?arrow_forwardCalculs Insights πT | cos x |³ dx 59 2arrow_forward
- 2. Consider the ODE u' = ƒ (u) = u² + r where r is a parameter that can take the values r = −1, −0.5, -0.1, 0.1. For each value of r: (a) Sketch ƒ(u) = u² + r and determine the equilibrium points. (b) Draw the phase line. (d) Determine the stability of the equilibrium points. (d) Plot the direction field and some sample solutions,i.e., u(t) (e) Describe how location of the equilibrium points and their stability change as you increase the parameter r. (f) Using the matlab program phaseline.m generate a solution for each value of r and the initial condition u(0) = 0.9. Print and turn in your result for r = −1. Do not forget to add a figure caption. (g) In the matlab program phaseline.m set the initial condition to u(0) = 1.1 and simulate the ode over the time interval t = [0, 10] for different values of r. What happens? Why? You do not need to turn in a plot for (g), just describe what happens.arrow_forwardThe following are suggested designs for group sequential studies. Using PROCSEQDESIGN, provide the following for the design O’Brien Fleming and Pocock.• The critical boundary values for each analysis of the data• The expected sample sizes at each interim analysisAssume the standardized Z score method for calculating boundaries.Investigators are evaluating the success rate of a novel drug for treating a certain type ofbacterial wound infection. Since no existing treatment exists, they have planned a one-armstudy. They wish to test whether the success rate of the drug is better than 50%, whichthey have defined as the null success rate. Preliminary testing has estimated the successrate of the drug at 55%. The investigators are eager to get the drug into production andwould like to plan for 9 interim analyses (10 analyzes in total) of the data. Assume thesignificance level is 5% and power is 90%.Besides, draw a combined boundary plot (OBF, POC, and HP)arrow_forward4. Solve the system of equations and express your solution using vectors. 2x1 +5x2+x3 + 3x4 = 9 -x2+x3 + x4 = 1 -x1-6x2+3x3 + 2x4 = -1arrow_forward
 Elementary Geometry For College Students, 7eGeometryISBN:9781337614085Author:Alexander, Daniel C.; Koeberlein, Geralyn M.Publisher:Cengage,
 Elementary Geometry for College StudentsGeometryISBN:9781285195698Author:Daniel C. Alexander, Geralyn M. KoeberleinPublisher:Cengage Learning
 Mathematics For Machine TechnologyAdvanced MathISBN:9781337798310Author:Peterson, John.Publisher:Cengage Learning,
 Trigonometry (MindTap Course List)TrigonometryISBN:9781337278461Author:Ron LarsonPublisher:Cengage Learning
 Algebra & Trigonometry with Analytic GeometryAlgebraISBN:9781133382119Author:SwokowskiPublisher:Cengage
 Holt Mcdougal Larson Pre-algebra: Student Edition...AlgebraISBN:9780547587776Author:HOLT MCDOUGALPublisher:HOLT MCDOUGAL