
a)
To determine: The standard time for the operation.
Introduction: Time study is the basis that helps set the standard time; it would time a sample of the performance of the worker.
a)
Answer to Problem 30P
Thestandard time is calculated as 85.56 minutes.
Explanation of Solution
Given information:
Fatigue factor is given as 10% and personal-time factor is 10%. Accuracy rate is ±5%. The observed time and performance rating for each element is given as follows:
| Element | Performance rating | Observation (minutes) | ||||||
| 1 | 2 | 3 | 4 | 5 | 6 | 7 | ||
| Select correct mufflers | 110% | 4 | 5 | 4 | 6 | 4 | 15a | 4 |
| Remove old muffler | 90% | 6 | 8 | 7 | 6 | 7 | 6 | 7 |
| Weld/install new muffler | 105% | 15 | 14 | 15 | 12 | 15 | 16 | 13 |
| Check/inspect work | 100% | 3 | 4 | 24a | 5 | 4 | 3 | 18a |
| Complete paperwork | 130% | 5 | 6 | 8 | - | 7 | 6 | 7 |
a refers to the fact that the employee has lengthy conversations with the boss (not job-related)
Formulae to calculate standard time:
Calculate normal time:
| Element | Performance rating | Observation (minutes) | Average time | Normal time | ||||||
| 1 | 2 | 3 | 4 | 5 | 6 | 7 | ||||
| Select correct mufflers | 110% | 4 | 5 | 4 | 6 | 4 | 15a | 4 | 4.50 | 4.95 |
| Remove old muffler | 90% | 6 | 8 | 7 | 6 | 7 | 6 | 7 | 6.71 | 6.04 |
| Weld/install new muffler | 105% | 15 | 14 | 14 | 12 | 15 | 16 | 13 | 14.14 | 14.85 |
| Check/inspect work | 100% | 3 | 4 | 24a | 5 | 4 | 3 | 18a | 3.80 | 3.80 |
| Complete paperwork | 130% | 5 | 6 | 8 | - | 7 | 6 | 7 | 6.50 | 8.45 |
Excel worksheet:
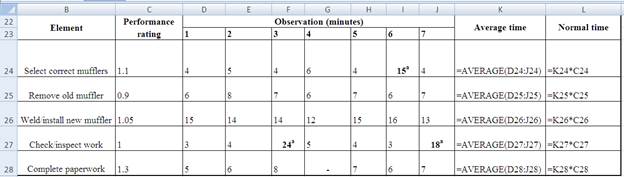
Calculate the average time to select correct mufflers:
The average time is calculated by taking an average of the observation given, which is the summation of 4, 5, 4, 6, 4, and 4 and dividing the result by 6. Hence, the average is 4.5 minutes.
Note: The observation with (Xa) should not be considered while calculating the average time.
Calculate the average time to remove the old muffler:
The average time is calculated by taking an average of the observation given, which is the summation of 6, 8, 7, 6, 7, 6, and 7 and dividing the result by 7. Hence, the average is 6.71 minutes.
Calculate the average time to weld or install a new muffler:
The average time is calculated by taking an average of the observation given, which is the summation of 15, 14, 14, 12, 15, 16, and 13 and dividing the result by 7. Hence, the average is 14.14 minutes.
Calculate the average time to check or inspect work:
The average time is calculated by taking an average of the observation given, which is the summation of 3, 4, 5, 4, and 3 and dividing the result by 5. Hence, the average is 3.80 minutes.
Note: The observation with (Xa) should not be considered while calculating the average time.
Calculate the average time to complete paperwork:
The average time is calculated by taking an average of the observation given, which is the summation of 5, 6, 8, 7, 6, and 7 and dividing the result by 6. Hence, the average is 6.50 minutes.
Calculate the normal time to select correct mufflers:
The normal time is calculated by multiplying the average time and performance rating. Average time is calculated as 4.50 minutes and performance rating is given as 110%. Hence, the normal time is 4.95 minutes.
Calculate the normal time to remove the old muffler:
The normal time is calculated by multiplying the average time and performance rating. Average time is calculated as 6.71 minutes and performance rating is given as 90%. Hence, the normal time is 6.04 minutes.
Calculate the normal time to weld or install a new muffler:
The normal time is calculated by multiplying the average time and performance rating. Average time is calculated as 14.14 minutes and performance rating is given as 105%. Hence, the normal time is 14.85 minutes.
Calculate the normal time to check or inspect work:
The normal time is calculated by multiplying the average time and performance rating. Average time is calculated as 3.80 minutes and performance rating is given as 100%. Hence, the normal time is 3.80 minutes.
Calculate the normal time to complete paperwork:
The normal time is calculated by multiplying the average time and performance rating. Average time is calculated as 6.50 minutes and performance rating is given as 130%. Hence, the normal time is 8.45 minutes.
Calculate the total normal time:
The normal time is calculated by multiplying the average time and performance rating. Average time is calculated as 6.50 minutes and performance rating is given as 130%. Hence, the normal time is 8.45 minutes.
Normal time is calculated by adding the normal time to select correct mufflers, remove the old muffler, weld or install a new muffler, check or inspect work, and to complete paperwork.
Hence, the total normal time is 38.09 minutes.
Calculate the standard time:
The standard time is calculated by dividing the normal time with the value attained by subtracting the allowance factor from 1. Normal time is calculated as 38.09 minutes and allowance factor is calculated as the sum of fatigue factor, which is 10% and personal time factor, which is 10%.
Hence, the standard time is 47.6 minutes.
b)
To determine: The number of
Introduction: Thesample size is required to determine the number of observations that are necessary to find the true cycle time.
b)
Answer to Problem 30P
Thesample size to select correct mufflers is 53, to remove the old muffler is 20, to weld or install a new muffler is 14, to check or inspect work is 75, and to complete paperwork is 40 samples.
Explanation of Solution
Given information:
Confidence level is 95% and accuracy is ±5%.
| Element | Performance rating | Observation (minutes) | ||||||
| 1 | 2 | 3 | 4 | 5 | 6 | 7 | ||
| Select correct mufflers | 110% | 4 | 5 | 4 | 6 | 4 | 15a | 4 |
| Remove old muffler | 90% | 6 | 8 | 7 | 6 | 7 | 6 | 7 |
| Weld/install new muffler | 105% | 15 | 14 | 15 | 12 | 15 | 16 | 13 |
| Check/inspect work | 100% | 3 | 4 | 24a | 5 | 4 | 3 | 18a |
| Complete paperwork | 130% | 5 | 6 | 8 | - | 7 | 6 | 7 |
a refers to the fact that the employee has lengthy conversation with the boss (not job-related)
Formulae to determine the required number of observation:
n refers to number of observations required
z refers to the table value for confidence level
s refers to standard deviation
h refers to accuracy level
Determine the proper number of observations required:
| Element | Performance rating | Observation (minutes) | Average time | s | Sample | ||||||
| 1 | 2 | 3 | 4 | 5 | 6 | 7 | |||||
| Select correct mufflers | 110% | 4 | 5 | 4 | 6 | 4 | 15a | 4 | 4.50 | 0.836 | 53.1 |
| Remove old muffler | 90% | 6 | 8 | 7 | 6 | 7 | 6 | 7 | 6.71 | 0.755 | 19.5 |
| Weld/install new muffler | 105% | 15 | 14 | 14 | 12 | 15 | 16 | 13 | 14.14 | 1.345 | 13.9 |
| Check/inspect work | 100% | 3 | 4 | 24a | 5 | 4 | 3 | 18a | 3.80 | 0.836 | 74.5 |
| Complete paperwork | 130% | 5 | 6 | 8 | - | 7 | 6 | 7 | 6.50 | 1.048 | 40.0 |
Excel worksheet:
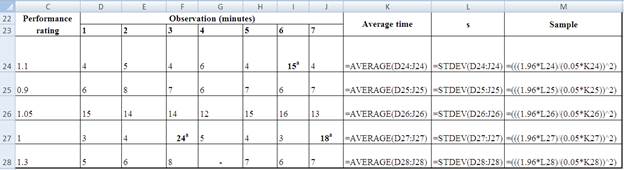
Calculate the standard deviation to select correct mufflers:
The standard deviation can be calculated by dividing two values. The first value can be calculated by adding the square of the value attained by subtracting the mean observed value from each observation. The second value can be attained by subtracting 1 from the number of samples and the result should be square rooted. Standard deviation to select correct mufflers is 0.836.
Calculate standard deviation to remove old muffler:
The standard deviation can be calculated by dividing two values. The first value can be calculated by adding the square of the value attained by subtracting the mean observed value from each observation. The second value can be attained by subtracting 1 from the number of samples and the result should be square rooted. Standard deviation to remove old muffler is 0.755.
Calculate standard deviation to weld or install new muffler:
The standard deviation can be calculated by dividing two values. The first value can be calculated by adding the square of the value attained by subtracting the mean observed value from each observation. The second value can be attained by subtracting 1 from the number of samples and the result should be square rooted. Standard deviation to weld or install new muffler is 1.345.
Calculate standard deviation to check or inspect work:
The standard deviation can be calculated by dividing two values. The first value can be calculated by adding the square of the value attained by subtracting the mean observed value from each observation. The second value can be attained by subtracting 1 from the number of samples and the result should be square rooted. Standard deviation to check or inspect work is 0.836.
Calculate standard deviation to complete paperwork:
The standard deviation can be calculated by dividing two values. The first value can be calculated by adding the square of the value attained by subtracting the mean observed value from each observation. The second value can be attained by subtracting 1 from the number of samples and the result should be square rooted. Standard deviation to check or inspect work is 1.048.
Calculate the sample size to select correct mufflers:
It is calculated by multiplying the z value of 1.96, the standard deviation that is given as 0.836, and dividing the resultant with the multiple of the accuracy level and the average observed time that is given as 0.05 and 4.5, respectively. Hence, the required number of observations is 53 samples.
Calculate the sample size to remove the old muffler:
It is calculated by multiplying the z value of 1.96, the standard deviation that is given as 0.755, and dividing the resultant with the multiple of the accuracy level and the average observed time that is given as 0.05 and 6.71, respectively. Hence, the required number of observations is 20 samples.
Calculate the sample size to weld or install a new muffler:
It is calculated by multiplying the z value of 1.96, the standard deviation that is given as 1.345, and dividing the resultant with the multiple of the accuracy level and the average observed time that is given as 0.05 and 14.14, respectively. Hence, the required number of observations is 14 samples.
Calculate the sample size to check or inspect work:
It is calculated by multiplying the z value of 1.96, the standard deviation that is given as 0.836, and dividing the resultant with the multiple of the accuracy level and the average observed time that is given as 0.05 and 3.8, respectively. Hence, the required number of observations is 75 samples.
Calculate the sample size to complete paperwork:
It is calculated by multiplying the z value of 1.96, the standard deviation that is given as 1.048, and dividing the resultant with the multiple of the accuracy level and the average observed time that is given as 0.05 and 6.5, respectively. Hence, the required number of observations is 40 samples.
Hence, the standard time for the process is 47.6 minutes. The sample size to select correct mufflers are 53, to remove the old muffler is 20, weld or install a new muffler is 14, to check or inspect work is 75 samples, and to complete paperwork is 40 samples.
Want to see more full solutions like this?
Chapter 10 Solutions
Pearson eText Principles of Operations Management: Sustainability and Supply Chain Management -- Instant Access (Pearson+)

- PepsiCo South Africa says the incident where a woman discovered part of a rodent in her loaf of bread, is anisolated occurrence.Durban woman, Nombulelo Mkumla, took to social media last week to share how she discovered the rodent.In a lengthy Facebook post, she said she purchased the loaf of bread from a local shop after work on August 27.For the next days, Mkumla proceeded to use slices of bread from the load to make toast."Then, on the morning of August 31, I took the bread out of the fridge to make toast and noticed something disgusting andscary. I took a picture and sent it to my friends, and one of them said, 'Yi mpuku leyo tshomi' [That's a rat friend]“."I was in denial and suggested it might be something else, but the rat scenario made sense - it's possible the rat got into thebread at the factory, and no one noticed," Mkumla said.She went back to the shop she'd bought the bread from and was told to lay a complaint directly with the supplier.She sent an email with a video and…arrow_forwardThe deaths are included in the discharges; this includes deaths occurring in less than 48 hours and postoperative deaths. Rehabilitation had 362 discharges, 22 deaths, 1<48 hours, 0 Postoperative. what is the gross death rate for the rehabilitation service?arrow_forwardA copy machine is available 24 hours a day. On a typical day, the machine produces 100 jobs. Each job takes about 3 minutes on the machine, 2 minutes of which is processing time and 1 minute is setup time (logging in, defining the job). About 20 percent of the jobs need to be reworked, in which case the setup time and the processing time have to be repeated. The remainder of the time, the equipment is idle. What is the OEE of the equipment?arrow_forward
- How do you think we can keep updating Toyota's ideas as new technologies come out and what customers want keeps changing?arrow_forwardGiven how TPS has helped change things in so many fields, do you think there are parts of it that might be hard to use in areas that aren’t about making things, like in healthcare or services? If so, why do you think that might be?arrow_forwardDo you feel there is anything positive about rework?arrow_forward
- Do you think technology can achieve faster setup times? How would it be implemented in the hospital workforce?arrow_forwardIn your experience or opinion, do you think process changes like organizing workspaces make a bigger difference, or is investing in technology usually the better solution for faster setups?arrow_forwardHave you seen rework done in your business, and what was done to prevent that from occurring again?arrow_forward
- Research a company different than case studies examined and search the internet and find an example of a business that had to rework a process. How was the organization affected to rework a process in order to restore a good flow unit? Did rework hurt a process or improve the organization's operational efficiency? • Note: Include a reference with supportive citations in the discussion reply in your post.arrow_forwardSetup time is very important in affecting a process and the capacity of a process. How do you reduce setup time? Give examples of reducing setup time. Please Provide a referenecearrow_forwardDo you think TPS was successful? If so, how? Are there other companies that have used TPS? If so, give examples. Please provide a referencearrow_forward

 Foundations of Business (MindTap Course List)MarketingISBN:9781337386920Author:William M. Pride, Robert J. Hughes, Jack R. KapoorPublisher:Cengage Learning
 Foundations of Business - Standalone book (MindTa...MarketingISBN:9781285193946Author:William M. Pride, Robert J. Hughes, Jack R. KapoorPublisher:Cengage Learning
 Understanding Management (MindTap Course List)ManagementISBN:9781305502215Author:Richard L. Daft, Dorothy MarcicPublisher:Cengage Learning