
Life: The Science of Biology
11th Edition
ISBN: 9781319010164
Author: David E. Sadava, David M. Hillis, H. Craig Heller, Sally D. Hacker
Publisher: W. H. Freeman
expand_more
expand_more
format_list_bulleted
Concept explainers
Question
Chapter 10, Problem 2Q
Summary Introduction
To review:
The difference in the rate of photosynthesis in shade-tolerant and shade-intolerant plants, and the reason for this difference.
Given:
The graphs representing the rate of photosynthesis as a function of the intensity of light are given below:
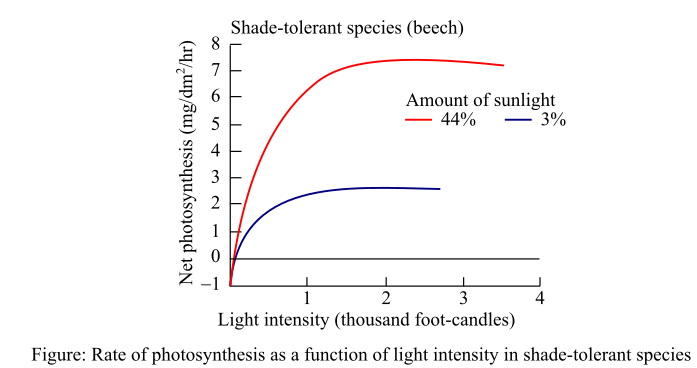
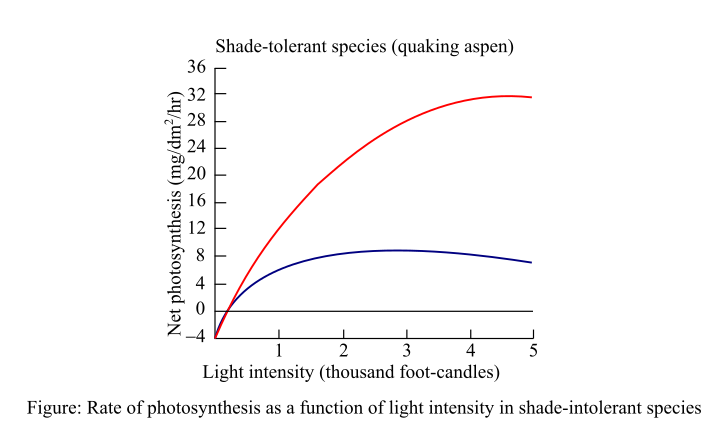
Introduction:
A shade-tolerant and a shade-intolerant plant were allowed to grow by 3% and 44% daylight conditions. After approximately 5 weeks, a leaf from both the plants was exposed to different light intensities and the rate of photosynthesis in its cells was measured.
Expert Solution & Answer
Want to see the full answer?
Check out a sample textbook solution
Students have asked these similar questions
What is agricu
When using the concept of "a calorie in is equal to a calorie out" how important is the quality of the calories?
What did the Cre-lox system used in the Kikuchi et al. 2010 heart regeneration experiment allow researchers to investigate?
What was the purpose of the cmlc2 promoter?
What is CreER and why was it used in this experiment?
If constitutively active Cre was driven by the cmlc2 promoter, rather than an inducible CreER system, what color would you expect new cardiomyocytes in the regenerated area to be no matter what? Why?
Chapter 10 Solutions
Life: The Science of Biology
Knowledge Booster


Learn more about
Need a deep-dive on the concept behind this application? Look no further. Learn more about this topic, biology and related others by exploring similar questions and additional content below.Similar questions
- What kind of organ size regulation is occurring when you graft multiple organs into a mouse and the graft weight stays the same?arrow_forwardWhat is the concept "calories consumed must equal calories burned" in regrads to nutrition?arrow_forwardYou intend to insert patched dominant negative DNA into the left half of the neural tube of a chick. 1) Which side of the neural tube would you put the positive electrode to ensure that the DNA ends up on the left side? 2) What would be the internal (within the embryo) control for this experiment? 3) How can you be sure that the electroporation method itself is not impacting the embryo? 4) What would you do to ensure that the electroporation is working? How can you tell?arrow_forward
- Describe a method to document the diffusion path and gradient of Sonic Hedgehog through the chicken embryo. If modifying the protein, what is one thing you have to consider in regards to maintaining the protein’s function?arrow_forwardThe following table is from Kumar et. al. Highly Selective Dopamine D3 Receptor (DR) Antagonists and Partial Agonists Based on Eticlopride and the D3R Crystal Structure: New Leads for Opioid Dependence Treatment. J. Med Chem 2016.arrow_forwardThe following figure is from Caterina et al. The capsaicin receptor: a heat activated ion channel in the pain pathway. Nature, 1997. Black boxes indicate capsaicin, white circles indicate resinferatoxin. You are a chef in a fancy new science-themed restaurant. You have a recipe that calls for 1 teaspoon of resinferatoxin, but you feel uncomfortable serving foods with "toxins" in them. How much capsaicin could you substitute instead?arrow_forward
- What protein is necessary for packaging acetylcholine into synaptic vesicles?arrow_forward1. Match each vocabulary term to its best descriptor A. affinity B. efficacy C. inert D. mimic E. how drugs move through body F. how drugs bind Kd Bmax Agonist Antagonist Pharmacokinetics Pharmacodynamicsarrow_forward50 mg dose of a drug is given orally to a patient. The bioavailability of the drug is 0.2. What is the volume of distribution of the drug if the plasma concentration is 1 mg/L? Be sure to provide units.arrow_forward
- Determine Kd and Bmax from the following Scatchard plot. Make sure to include units.arrow_forwardChoose a catecholamine neurotransmitter and describe/draw the components of the synapse important for its signaling including synthesis, packaging into vesicles, receptors, transporters/degradative enzymes. Describe 2 drugs that can act on this system.arrow_forwardThe following figure is from Caterina et al. The capsaicin receptor: a heat activated ion channel in the pain pathway. Nature, 1997. Black boxes indicate capsaicin, white circles indicate resinferatoxin. a) Which has a higher potency? b) Which is has a higher efficacy? c) What is the approximate Kd of capsaicin in uM? (you can round to the nearest power of 10)arrow_forward
arrow_back_ios
SEE MORE QUESTIONS
arrow_forward_ios
Recommended textbooks for you
 Biology (MindTap Course List)BiologyISBN:9781337392938Author:Eldra Solomon, Charles Martin, Diana W. Martin, Linda R. BergPublisher:Cengage Learning
 Biology: The Dynamic Science (MindTap Course List)BiologyISBN:9781305389892Author:Peter J. Russell, Paul E. Hertz, Beverly McMillanPublisher:Cengage Learning
 Biology 2eBiologyISBN:9781947172517Author:Matthew Douglas, Jung Choi, Mary Ann ClarkPublisher:OpenStax
 Biology: The Unity and Diversity of Life (MindTap...BiologyISBN:9781305073951Author:Cecie Starr, Ralph Taggart, Christine Evers, Lisa StarrPublisher:Cengage Learning
Biology (MindTap Course List)
Biology
ISBN:9781337392938
Author:Eldra Solomon, Charles Martin, Diana W. Martin, Linda R. Berg
Publisher:Cengage Learning
Biology: The Dynamic Science (MindTap Course List)
Biology
ISBN:9781305389892
Author:Peter J. Russell, Paul E. Hertz, Beverly McMillan
Publisher:Cengage Learning
Biology 2e
Biology
ISBN:9781947172517
Author:Matthew Douglas, Jung Choi, Mary Ann Clark
Publisher:OpenStax
Biology: The Unity and Diversity of Life (MindTap...
Biology
ISBN:9781305073951
Author:Cecie Starr, Ralph Taggart, Christine Evers, Lisa Starr
Publisher:Cengage Learning