
Concept explainers
Videos
To analyze:
The results of the investigation showing the relationship between gradual and sudden environmental changes on the extinction, evolution, and adaptation of the populations.
Given:
Overuse of drugs has been associated with the significant increase in drug-resistance. In the given experiment, the researchers use a serial transfer for propagating 1,255 population of Escherichia coli in gradually increasing antibiotic (rifampicin) concentration environment.
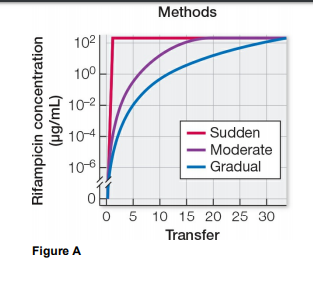
Figure A shows the increasing rifampicin concentrations which are increased suddenly, gradually and moderately.
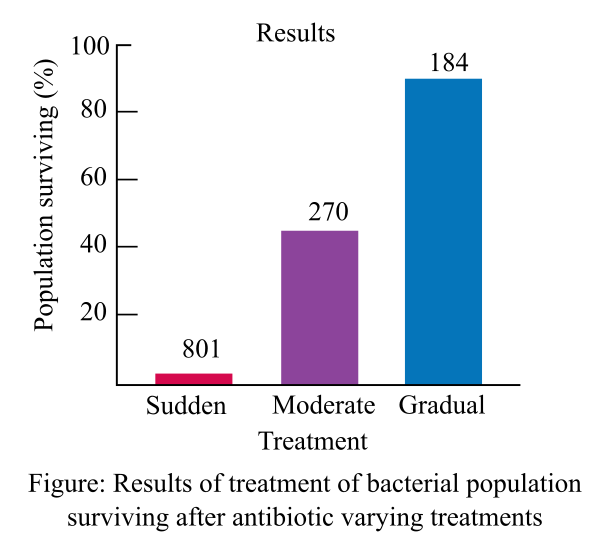
In the figure B the results of the experiments depicting the percentage of population surviving the antibiotic conditions are shown.
Introduction:
Extinction of the organisms is by the fact of sudden changes which occur in ecosystem. Sudden changes do not allow the organism to adapt and acclimatize to the environmental conditions. Gradual changes allow the organism to get accustomed to the changes and allow it to adapt accordingly.
Explanation of Solution
The experiment involved the exposure of antibiotic to the bacteria, by two ways one gradual other sudden. Survival population after treatment with different antibiotic concentrations at different rates differed greatly.
It is very much clear from survival population numbers in the graph that a sudden increase leads to the death because of such sudden increase in antibiotic concentration.
In the case of gradual increase the bacteria survived eventually end up becoming antibiotic resistant because of the fact that the gradual increase allowed the bacteria to save and protect itself by acquiring plasmids, point mutations, and genetic recombination.
The less time in sudden increase in antibiotics made the bacterium incapable of genetic exchange and hence the bacterial population decreased in numbers considerably.
The above experiment can explain the adaptation in case of multidrug resistant (MDR) and extensively drug resistant (XDR) species of Mycobacterium tuberculosis as well as sudden extinction of dinosaurs.
Therefore, it can be concluded that the extinction and loss of organisms is due to sudden change in environmental factors whereas acclimatization is the result of gradual changes in the environmental conditions.
Want to see more full solutions like this?
Chapter 1 Solutions
Life: The Science of Biology


- An urgent care center experienced the average patient admissions shown in the Table below during the weeks from the first week of December through the second week of April. Week Average Daily Admissions 1-Dec 11 2-Dec 14 3-Dec 17 4-Dec 15 1-Jan 12 2-Jan 11 3-Jan 9 4-Jan 9 1-Feb 12 2-Feb 8 3-Feb 13 4-Feb 11 1-Mar 15 2-Mar 17 3-Mar 14 4-Mar 19 5-Mar 13 1-Apr 17 2-Apr 13 Forecast admissions for the periods from the first week of December through the second week of April. Compare the forecast admissions to the actual admissions; What do you conclude?arrow_forwardAnalyze the effectiveness of the a drug treatment program based on the needs of 18-65 year olds who are in need of treatment by critically describing 4 things in the program is doing effectively and 4 things the program needs some improvement.arrow_forwardI have the first half finished... just need the bottom half.arrow_forward
- 13. Practice Calculations: 3 colonies were suspended in the following dilution series and then a viable plate count and microscope count was performed. Calculate IDF's, TDF's and then calculate the CFU/mL in each tube by both methods. Finally calculate the cells in 1 colony by both methods. Show all of your calculations in the space provided on the following pages. 3 colonies 56 cells 10 μL 10 μL 100 μL 500 με m OS A B D 5.0 mL 990 με 990 με 900 με 500 μL EN 2 100 με 100 μL 118 colonies 12 coloniesarrow_forwardDescribe and give a specific example of how successionary stage is related to species diversity?arrow_forwardExplain down bellow what happens to the cell in pictures not in words: Decreased pH in mitochondria Increased ATP Decreased pH in cytosol Increased hydrolysis Decreasing glycogen and triglycerides Increased MAP kinase activity Poor ion transport → For each one:→ What normally happens?→ What is wrong now?→ How does it mess up the cell?arrow_forward
- 1.) Community Diversity: The brown and orange line represent two different plant communities. a. Which color represents the community with a higher species richness? b. Which color represents the community with a higher species evenness? Relative abundance 0.1 0.04 0.001 2 4 6 8 10 12 14 16 18 20 22 24 Rank abundance c. What is the maximum value of the Simpson's diversity index (remember, Simpson's index is D = p², Simpson's diversity index is 1-D)? d. If the Simpson's diversity index equals 1, what does that mean about the number of species and their relative abundance within community being assessed?arrow_forward1.) Community Diversity: The brown and orange line represent two different plant communities. a. Which color represents the community with a higher species richness? b. Which color represents the community with a higher species evenness? Relative abundance 0.1 0.04 0.001 2 4 6 8 10 12 14 16 18 20 22 24 Rank abundance c. What is the maximum value of the Simpson's diversity index (remember, Simpson's index is D = p², Simpson's diversity index is 1-D)? d. If the Simpson's diversity index equals 1, what does that mean about the number of species and their relative abundance within community being assessed?arrow_forwardwhat measures can a mother to take to improve the produce of her to milk to her newborn baby ?arrow_forward
- 1. Color the line that represents all ancestors of the Eastern white pine tree green (but only the ancestral line NOT shared with other organisms) 2. Oncle the last common ancestor of the Colorado blue spruce tree and Eastern white pine tree. 3. Put a box around the last common ancestor of the sugar maple tree and the dogwood tree. 4. Put a triangle around the last common ancestor of the red pine tree and the american holly bush. 5. Color the line that represents all ancestors of the Ponderosa pine tree red (including all shared ancestors). 6. Color the line that represents all ancestors of the American elm tree blue (including all shared ancestors). 7 Color the line that represents all ancestors of the Sabal palm tree purple (including all shared ancestors) 8. Using a yellow highlighter or colored pencil, circle the clade that includes all pine trees. 9. Using a orange highlighter or colored pencil, circle the clade that includes all gymnosperms 10. Can you tell…arrow_forwardYou have been hired as a public relations specialist to give invertebrates a good name. After all, they are much more than just creepy crawly bugs! Your first task though is to convince yourself that is true. The best way to do that is to start close to home. Find something in your house that is a product obtained directly from an invertebrate or only due to an invertebrate’s actions. Describe the product, its function and utility, as well as any human manufactured alternatives. Be sure to highlight the advantages of obtaining this directly from nature. Keep in mind, a product can be something you use, wear, eat, or enjoy for its visual appeal.arrow_forwardUse the following tree diagram to answer Questions #8-10. 8) Which of the following two animals are the most closely related based on the tree to the left? a) Pig and camel b) Hippo and pig c) Deer and cow 9) CIRCLE on the tree diagram where the common ancestor between a hippo and a cow is. 10) Put a SQUARE on the tree diagram where the common ancestor between a pig and a peccary is.arrow_forward
 Biology (MindTap Course List)BiologyISBN:9781337392938Author:Eldra Solomon, Charles Martin, Diana W. Martin, Linda R. BergPublisher:Cengage Learning
 Concepts of BiologyBiologyISBN:9781938168116Author:Samantha Fowler, Rebecca Roush, James WisePublisher:OpenStax College
 Biology: The Dynamic Science (MindTap Course List)BiologyISBN:9781305389892Author:Peter J. Russell, Paul E. Hertz, Beverly McMillanPublisher:Cengage Learning
 Biology 2eBiologyISBN:9781947172517Author:Matthew Douglas, Jung Choi, Mary Ann ClarkPublisher:OpenStax
 Human Heredity: Principles and Issues (MindTap Co...BiologyISBN:9781305251052Author:Michael CummingsPublisher:Cengage Learning