
Concept explainers
Videos
To review:
Comparison of shade-tolerant and shade-intolerant plants, in terms of leaf surface area and reason for adaption to shade.
Given:
Table 1 represents the data related to specific leaf surface area in the shade-tolerant and shade-intolerant plants.
Table 1: The data related to specific leaf surface area in the shade-tolerant and shade-intolerant plants.
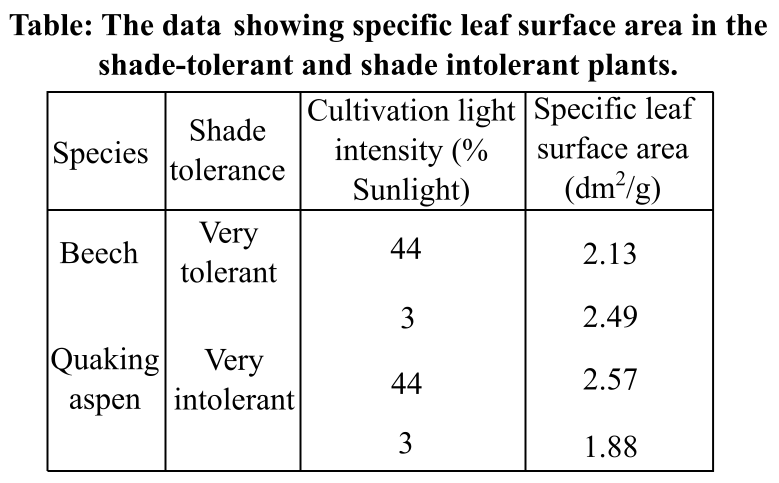
Where dm2/g denotes decimeter square per gram.
Introduction:
The surface area of leaves plays important role in the process of photosynthesis. The light required for photosynthesis is mainly absorbed by the leaves. Leaves with large surface areas are capable of absorbing more light than the leaves with less surface area. Shade intolerant and shade tolerant plants differ in the surface area of their leaves.
Want to see the full answer?
Check out a sample textbook solution
Chapter 10 Solutions
Life: The Science of Biology


- CHAPTER 12 LESSON 2 Applying Mendel's Principles READING TOOL Connect to Visuals Before you read, preview Figure 12-7. Try to infer the purpose of this diagram. As you read, compare your inference to the text. After you read, revise your statement if needed or write a new one about the diagram's purpose. Take notes on the lines provided. Then view the Punnett square and answer the questions below regarding the genotypes and phenotypes. Inference: Revision: Parent 2 rryy Gametes F ry Parent 1 RRYY Gametes RY RrYy The F, generation are all RrYy. 1. What is the phenotype of parent 1?. 2. What is the genotype of parent 1? 3. What is the phenotype of parent 2? 4. What is the genotype of parent 2? 5. What is the phenotype of the F, offspring?. 6. What is the genotype of the F, offspring?. 7. What kind of cross does this figure describe? 144 Chanter 12 Introduction to Genetice Copyright Pearson Education Inc. or its affiliator. All rights reserved.arrow_forwardHow is the term enzyme related to the term proteinarrow_forwardCan very low temperatures cause proteins to denature? Explain why or why not?arrow_forward
- Humans consider themselves amazingly clever and innovative, constantly developing "new" ways of altering the world around us. As material consumption has increased, many have turned to the ideas of recycling and reuse as a means to minimize some negative aspects of our modern consumerism. Mother Nature though is the ultimate innovator and, more importantly, the ultimate recycler.arrow_forwardH gene assorts independently from the I gene. Both on autosomes. One man and one woman, both of HhIAIB genotype. Determine the blood type of progeny and fractions out of 16arrow_forwardAlleles at the P locus control seed color. Plants which are pp have white seeds, white flowers and no pigment in vegetative parts. Plants which are P_ have black seeds, purple flowers and may have varying degrees of pigment on stems and leaves. Seed color can be assessed, visually, based on if the seed is white or not white A gene for mold resistance has been reported and we want to determine its inheritance and whether it is linked to P. For the purposes of this exercise, we will assume that resistance is controlled by a single locus M, and M_ plants are resistant and mm plants are susceptible. Resistance can be measured, under greenhouse conditions, 2 weeks after planting, by injecting each seedling with a spore suspension. After two weeks, the seedlings can be rated as resistant or susceptible, based on whether or not tissue is actively sporulating. For this exercise we will use seed and data from the F10 generation of a recombinant inbred population produced using single seed…arrow_forward
- Linkage in common bean Alleles at the P locus control seed color. Plants which are pp have white seeds, white flowers and no pigment in vegetative parts. Plants which are P_ have black seeds, purple flowers and may have varying degrees of pigment on stems and leaves. Seed color can be assessed, visually, based on if the seed is white or not white A gene for mold resistance has been reported and we want to determine its inheritance and whether it is linked to P. For the purposes of this exercise, we will assume that resistance is controlled by a single locus M, and M_ plants are resistant and mm plants are susceptible. Resistance can be measured, under greenhouse conditions, 2 weeks after planting, by injecting each seedling with a spore suspension. After two weeks, the seedlings can be rated as resistant or susceptible, based on whether or not tissue is actively sporulating. For this exercise we will use seed and data from the F10 generation of a recombinant inbred population…arrow_forwardAlleles at the P locus control seed color. Plants which are pp have white seeds, white flowers and no pigment in vegetative parts. Plants which are P_ have black seeds, purple flowers and may have varying degrees of pigment on stems and leaves. Seed color can be assessed, visually, based on if the seed is white or not white A gene for mold resistance has been reported and we want to determine its inheritance and whether it is linked to P. For the purposes of this exercise, we will assume that resistance is controlled by a single locus M, and M_ plants are resistant and mm plants are susceptible. Resistance can be measured, under greenhouse conditions, 2 weeks after planting, by injecting each seedling with a spore suspension. After two weeks, the seedlings can be rated as resistant or susceptible, based on whether or not tissue is actively sporulating. For this exercise we will use seed and data from the F10 generation of a recombinant inbred population produced using single seed…arrow_forwardcan you help? I think its B but not surearrow_forward
- Skip to main content close Homework Help is Here – Start Your Trial Now! arrow_forward search SEARCH ASK Human Anatomy & Physiology (11th Edition)BUY Human Anatomy & Physiology (11th Edition) 11th Edition ISBN: 9780134580999 Author: Elaine N. Marieb, Katja N. Hoehn Publisher: PEARSON 1 The Human Body: An Orientation expand_moreChapter 1 : The Human Body: An Orientation Chapter Questions expand_moreSection: Chapter Questions Problem 1RQ: The correct sequence of levels forming the structural hierarchy is A. (a) organ, organ system,... format_list_bulletedProblem 1RQ: The correct sequence of levels forming the structural hierarchy is A. (a) organ, organ system,... See similar textbooks Bartleby Related Questions Icon Related questions Bartleby Expand Icon bartleby Concept explainers bartleby Question Draw a replication bubble with two replication forks.blue lines are DNA single strands and red lines are RNA single strands.indicate all 3' and 5’ ends on all DNA single…arrow_forwardProvide an answerarrow_forwardQuestion 4 1 pts Which of the following would be most helpful for demonstrating alternative splicing for a new organism? ○ its proteome and its transcriptome only its transcriptome only its genome its proteome and its genomearrow_forward

 Biology (MindTap Course List)BiologyISBN:9781337392938Author:Eldra Solomon, Charles Martin, Diana W. Martin, Linda R. BergPublisher:Cengage Learning
 Biology: The Dynamic Science (MindTap Course List)BiologyISBN:9781305389892Author:Peter J. Russell, Paul E. Hertz, Beverly McMillanPublisher:Cengage Learning