
Concept explainers
a)
To construct: A
Introduction: Quality is a measure of excellence or a state of being free from deficiencies, defects and important variations. It is obtained by consistent and strict commitment to certain standards to attain uniformity of a product to satisfy consumers’ requirement.
a)
Answer to Problem 12P
Explanation of Solution
Given information:
| Sample | Mean | Sample | Mean | Sample | Mean | Sample | Mean |
| 1 | 3.86 | 11 | 3.88 | 21 | 3.84 | 31 | 3.88 |
| 2 | 3.90 | 12 | 3.86 | 22 | 3.82 | 32 | 3.76 |
| 3 | 3.83 | 13 | 3.88 | 23 | 3.89 | 33 | 3.83 |
| 4 | 3.81 | 14 | 3.81 | 24 | 3.86 | 34 | 3.77 |
| 5 | 3.84 | 15 | 3.83 | 25 | 3.88 | x35 | 3.86 |
| 6 | 3.83 | 16 | 3.86 | 26 | 3.90 | 36 | 3.80 |
| 7 | 3.87 | 17 | 3.82 | 27 | 3.81 | 37 | 3.84 |
| 8 | 3.88 | 18 | 3.86 | 28 | 3.86 | 38 | 3.79 |
| 9 | 3.84 | 19 | 3.84 | 29 | 3.98 | 39 | 3.85 |
| 10 | 3.80 | 20 | 3.87 | 30 | 3.96 |
Formula:
Calculation of control limits and construction of
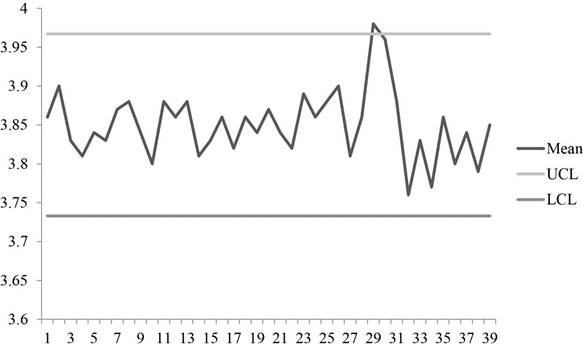
Graph shows the plot for sample means with UCL and LCL values. It can be observed that some points are above the control limits. So, the process is out of control.
Hence, the process is not in control.
b)
To analyze: The data using median run test and up and down run test and conclude the results.
Introduction: Quality is a measure of excellence or a state of being free from deficiencies, defects and important variations. It is obtained by consistent and strict commitment to certain standards to attain uniformity of a product to satisfy consumers’ requirement.
b)
Answer to Problem 12P
Explanation of Solution
Given information:
| Sample | Mean | Sample | Mean | Sample | Mean | Sample | Mean |
| 1 | 3.86 | 11 | 3.88 | 21 | 3.84 | 31 | 3.88 |
| 2 | 3.90 | 12 | 3.86 | 22 | 3.82 | 32 | 3.76 |
| 3 | 3.83 | 13 | 3.88 | 23 | 3.89 | 33 | 3.83 |
| 4 | 3.81 | 14 | 3.81 | 24 | 3.86 | 34 | 3.77 |
| 5 | 3.84 | 15 | 3.83 | 25 | 3.88 | x35 | 3.86 |
| 6 | 3.83 | 16 | 3.86 | 26 | 3.90 | 36 | 3.80 |
| 7 | 3.87 | 17 | 3.82 | 27 | 3.81 | 37 | 3.84 |
| 8 | 3.88 | 18 | 3.86 | 28 | 3.86 | 38 | 3.79 |
| 9 | 3.84 | 19 | 3.84 | 29 | 3.98 | 39 | 3.85 |
| 10 | 3.80 | 20 | 3.87 | 30 | 3.96 |
Formula:
Analysis of data:
To make analysis of data, the given data is compared with median 3.85 to make A/B and U/D.
| Sample | A/B | Mean | U/D | Sample | A/B | Mean | U/D |
| 1 | A | 3.86 | - | 21 | B | 3.84 | D |
| 2 | A | 3.90 | U | 22 | B | 3.82 | D |
| 3 | B | 3.83 | D | 23 | A | 3.89 | U |
| 4 | B | 3.81 | D | 24 | A | 3.86 | D |
| 5 | B | 3.84 | U | 25 | A | 3.88 | U |
| 6 | B | 3.83 | D | 26 | A | 3.90 | U |
| 7 | A | 3.87 | U | 27 | B | 3.81 | D |
| 8 | A | 3.88 | U | 28 | A | 3.86 | U |
| 9 | B | 3.84 | D | 29 | A | 3.98 | U |
| 10 | B | 3.80 | D | 30 | A | 3.96 | D |
| 11 | A | 3.88 | U | 31 | A | 3.88 | D |
| 12 | A | 3.86 | D | 32 | B | 3.76 | D |
| 13 | A | 3.88 | U | 33 | B | 3.83 | U |
| 14 | B | 3.81 | D | 34 | B | 3.77 | D |
| 15 | B | 3.83 | U | 35 | A | 3.86 | U |
| 16 | A | 3.86 | U | 36 | B | 3.80 | D |
| 17 | B | 3.82 | D | 37 | B | 3.84 | U |
| 18 | A | 3.86 | U | 38 | B | 3.79 | D |
| 19 | B | 3.84 | D | 39 | B | 3.85 | U |
| 20 | A | 3.87 | U |
Sample 39 ties with the median and in order to maximize the Ztest statistics, the sample 39 is labeled as B. Therefore, the observed number of runs is 18.
Median run test:
Calculation of expected number of runs:
The expected number of runs is calculated by adding half of the total number of samples with 1 which gives 20.5.
Calculation of standard deviation:
Standard deviation is calculated by subtracting number of sample 39 from 1 and dividing the resultant by 4 and taking square for the value which yields 3.08.
The z factor for median is calculated by dividing the difference of 18 and 20.5 with 3.08 which yields -0.81 which is within the test statistics of ±2.
Up/Down Test:
The observed number of runs from the analysis is 29.
Calculation of expected number of runs:
The expected number of runs is calculated by subtracting the double of the number of samples 39 and subtracting from1 and dividing the resultant with 3 which gives 25.7.
Calculation of standard deviation:
Standard deviation is calculated by multiplying the number of samples with 16 and subtracting the resultant from 29 and then dividing the resulting value with 90 and taking square root which yields 2.57.
The z factor for median is calculated by dividing the difference of 29 and 25.7 with 2.57 which yields +1.28 which is within the test statistics of ±2.
Hence, the results of the median run test and up/down test is random and no non randomness is detected.
Want to see more full solutions like this?
Chapter 10 Solutions
Operations Management (Comp. Instructor's Edition)


- PepsiCo South Africa says the incident where a woman discovered part of a rodent in her loaf of bread, is anisolated occurrence.Durban woman, Nombulelo Mkumla, took to social media last week to share how she discovered the rodent.In a lengthy Facebook post, she said she purchased the loaf of bread from a local shop after work on August 27.For the next days, Mkumla proceeded to use slices of bread from the load to make toast."Then, on the morning of August 31, I took the bread out of the fridge to make toast and noticed something disgusting andscary. I took a picture and sent it to my friends, and one of them said, 'Yi mpuku leyo tshomi' [That's a rat friend]“."I was in denial and suggested it might be something else, but the rat scenario made sense - it's possible the rat got into thebread at the factory, and no one noticed," Mkumla said.She went back to the shop she'd bought the bread from and was told to lay a complaint directly with the supplier.She sent an email with a video and…arrow_forwardThe deaths are included in the discharges; this includes deaths occurring in less than 48 hours and postoperative deaths. Rehabilitation had 362 discharges, 22 deaths, 1<48 hours, 0 Postoperative. what is the gross death rate for the rehabilitation service?arrow_forwardA copy machine is available 24 hours a day. On a typical day, the machine produces 100 jobs. Each job takes about 3 minutes on the machine, 2 minutes of which is processing time and 1 minute is setup time (logging in, defining the job). About 20 percent of the jobs need to be reworked, in which case the setup time and the processing time have to be repeated. The remainder of the time, the equipment is idle. What is the OEE of the equipment?arrow_forward
- How do you think we can keep updating Toyota's ideas as new technologies come out and what customers want keeps changing?arrow_forwardGiven how TPS has helped change things in so many fields, do you think there are parts of it that might be hard to use in areas that aren’t about making things, like in healthcare or services? If so, why do you think that might be?arrow_forwardDo you feel there is anything positive about rework?arrow_forward
- Do you think technology can achieve faster setup times? How would it be implemented in the hospital workforce?arrow_forwardIn your experience or opinion, do you think process changes like organizing workspaces make a bigger difference, or is investing in technology usually the better solution for faster setups?arrow_forwardHave you seen rework done in your business, and what was done to prevent that from occurring again?arrow_forward
- Research a company different than case studies examined and search the internet and find an example of a business that had to rework a process. How was the organization affected to rework a process in order to restore a good flow unit? Did rework hurt a process or improve the organization's operational efficiency? • Note: Include a reference with supportive citations in the discussion reply in your post.arrow_forwardSetup time is very important in affecting a process and the capacity of a process. How do you reduce setup time? Give examples of reducing setup time. Please Provide a referenecearrow_forwardDo you think TPS was successful? If so, how? Are there other companies that have used TPS? If so, give examples. Please provide a referencearrow_forward
 Practical Management ScienceOperations ManagementISBN:9781337406659Author:WINSTON, Wayne L.Publisher:Cengage,
 Foundations of Business (MindTap Course List)MarketingISBN:9781337386920Author:William M. Pride, Robert J. Hughes, Jack R. KapoorPublisher:Cengage Learning
 Foundations of Business - Standalone book (MindTa...MarketingISBN:9781285193946Author:William M. Pride, Robert J. Hughes, Jack R. KapoorPublisher:Cengage Learning