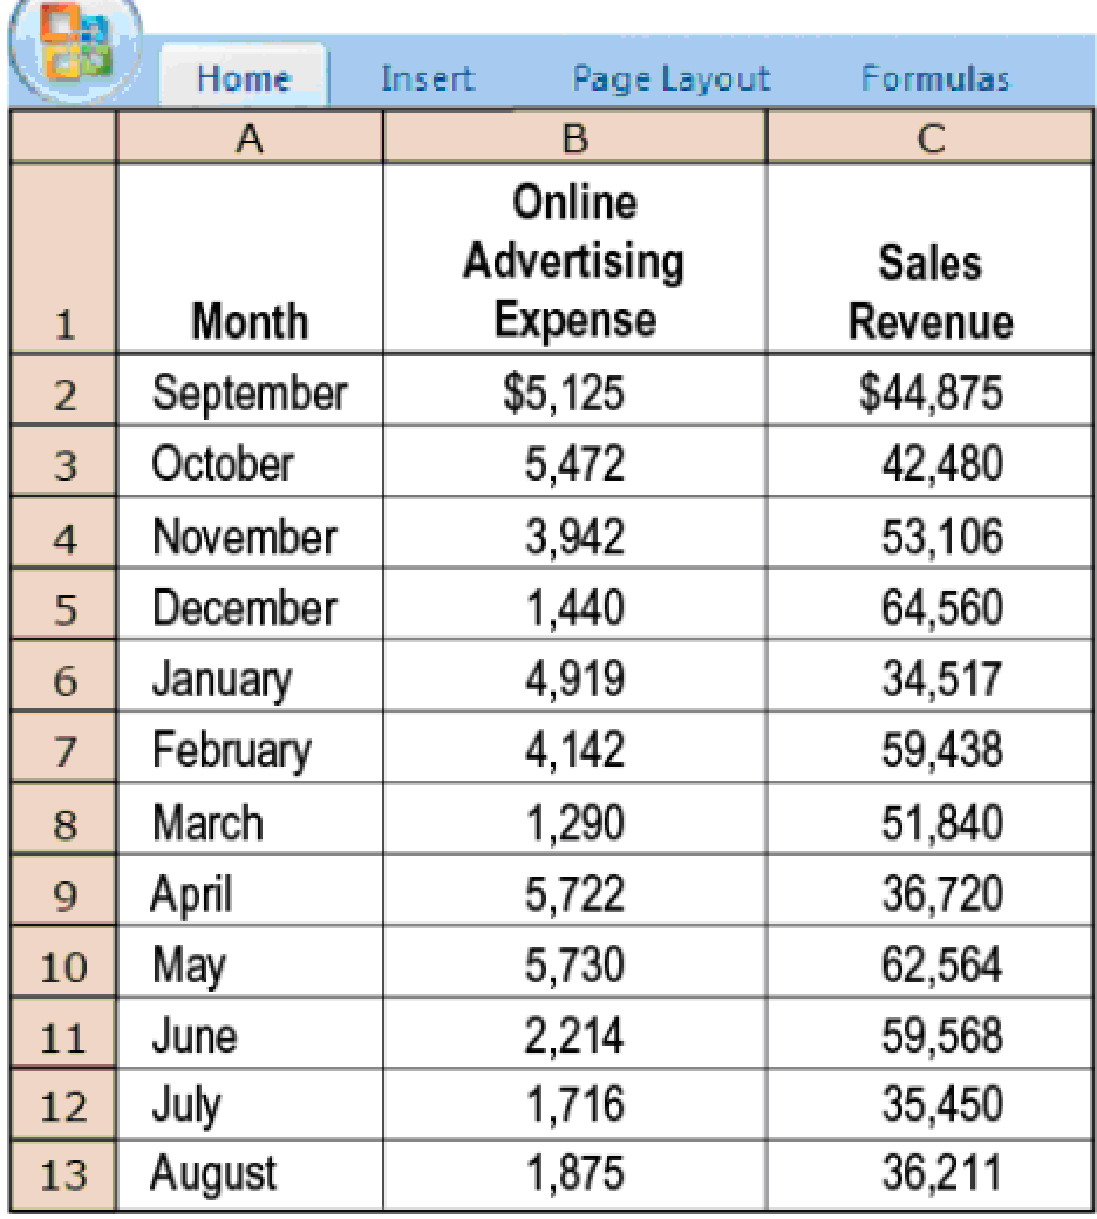
Interpreting regression results, matching time periods. Nandita Summers works at Modus, a store that caters to fashion for young adults. Nandita is responsible for the store’s online advertising and promotion budget. For the past year, she has studied search engine optimization and has been purchasing keywords and display advertising on Google, Facebook, and Twitter. In order to analyze the effectiveness of her efforts and to decide whether to continue online advertising or move her advertising dollars back to traditional print media, Nandita collects the following data:

- 1. Nandita performs a regression analysis, comparing each month’s online advertising expense with that month’s revenue. Verify that she obtains the following result:
Required

- 2. Plot the preceding data on a graph and draw the regression line. What does the cost formula indicate about the relationship between monthly online advertising expense and monthly revenues? Is the relationship economically plausible?
- 3. After further thought, Nandita realizes there may have been a flaw in her approach. In particular, there may be a lag between the time customers click through to the Modus website and peruse its social media content (which is when the online ad expense is incurred) and the time they actually shop in the physical store. Nandita modifies her analysis by comparing each month’s sales revenue to the advertising expense in the prior month. After discarding September revenue and August advertising expense, show that the modified regression yields the following:

- 4. What does the revised formula indicate? Plot the revised data on a graph. Is this relationship economically plausible?
- 5. Can Nandita conclude that there is a cause-and-effect relationship between online advertising expense and sales revenue? Why or why not?
Want to see the full answer?
Check out a sample textbook solution
Chapter 10 Solutions
Horngren's Cost Accounting: A Managerial Emphasis (16th Edition)
- What Is the correct answer A B ?? General Accounting questionarrow_forwardCullumber Company uses a job order cost system and applies overhead to production on the basis of direct labor costs. On January 1, 2025, Job 50 was the only job in process. The costs incurred prior to January 1 on this job were as follows: direct materials $16,800, direct labor $10,080, and manufacturing overhead $13,440. As of January 1, Job 49 had been completed at a cost of $75,600 and was part of finished goods inventory. There was a $12,600 balance in the Raw Materials Inventory account on January 1. During the month of January, Cullumber Company began production on Jobs 51 and 52, and completed Jobs 50 and 51. Jobs 49 and 50 were sold on account during the month for $102,480 and $132,720, respectively. The following additional events occurred during the month. 1. Purchased additional raw materials of $75,600 on account. 2. Incurred factory labor costs of $58,800. 3. Incurred manufacturing overhead costs as follows: depreciation expense on equipment $10,080; and various other…arrow_forwardAccounting questionarrow_forward
- Determine the cost of the patent.arrow_forwardAccounting questionarrow_forwardMs. Sharon Washton was born 26 years ago in Bahn, Germany. She is the daughter of a Canadian High Commissioner serving in that country. However, Ms. Washton is now working in Prague, Czech Republic. The only income that she earns in the year is from her Prague marketing job, $55,000 annually, and is subject to income tax in Czech Republic. She has never visited Canada. Determine the residency status of Sharon Washtonarrow_forward
 Essentials of Business Analytics (MindTap Course ...StatisticsISBN:9781305627734Author:Jeffrey D. Camm, James J. Cochran, Michael J. Fry, Jeffrey W. Ohlmann, David R. AndersonPublisher:Cengage LearningPrinciples of Accounting Volume 2AccountingISBN:9781947172609Author:OpenStaxPublisher:OpenStax College

