
Concept explainers
Videos
(a)
Interpretation:
The volume of a bacterial cell in cubic millimeters
Concept introduction:
Volume is a physical quantity and its SI unit is cubic meter
The conversion of one unit into another can be done using a proper conversion factor. Conversion factors are the ratios that relate the two different units of a quantity. It is also known as dimensional analysis or factor label method.
In the unit conversion problems, the given information is multiplied by the conversion factors to obtain the desired information. The unit conversion can be done as follows:
(a)
Answer to Problem 1.36P
The volume of a bacterial cell in cubic millimeters
Explanation of Solution
The volume of a bacterial cell in cubic micrometer
The road map to calculate the volume of a bacterial cell in cubic millimeters
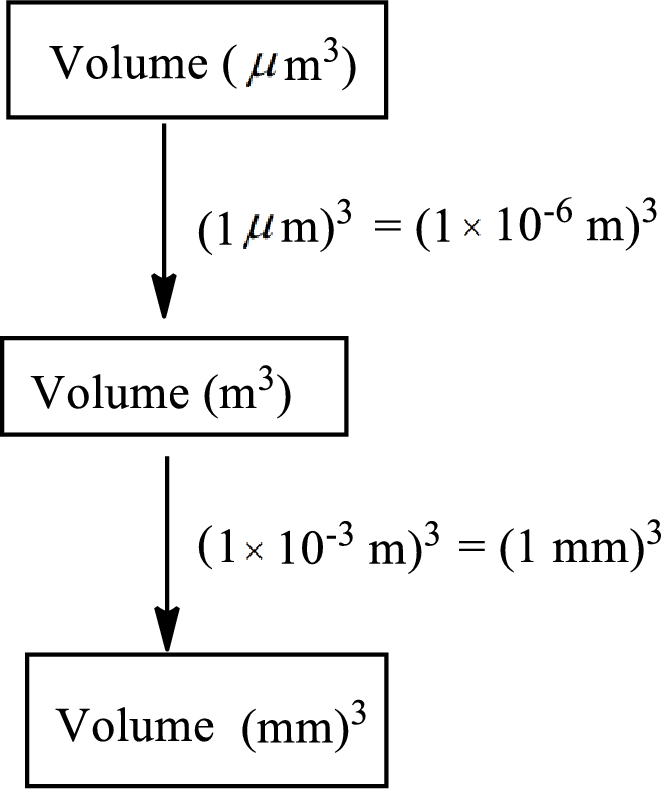
The conversion factor to convert volume from cubic micrometer
The conversion factor to convert volume from cubic meter
Convert the volume from cubic micrometer
The volume of a bacterial cell in cubic millimeters
(b)
Interpretation:
The volume of
Concept introduction:
Volume is a physical quantity and its SI unit is cubic meter
The conversion of one unit into another can be done using a proper conversion factor. Conversion factors are the ratios that relate the two different units of a quantity. It is also known as dimensional analysis or factor label method.
In the unit conversion problems, the given information is multiplied by the conversion factors to obtain the desired information. The unit conversion can be done as follows:
(b)
Answer to Problem 1.36P
The volume of
Explanation of Solution
The volume of a bacterial cell in cubic micrometer
The road map to calculate the volume of
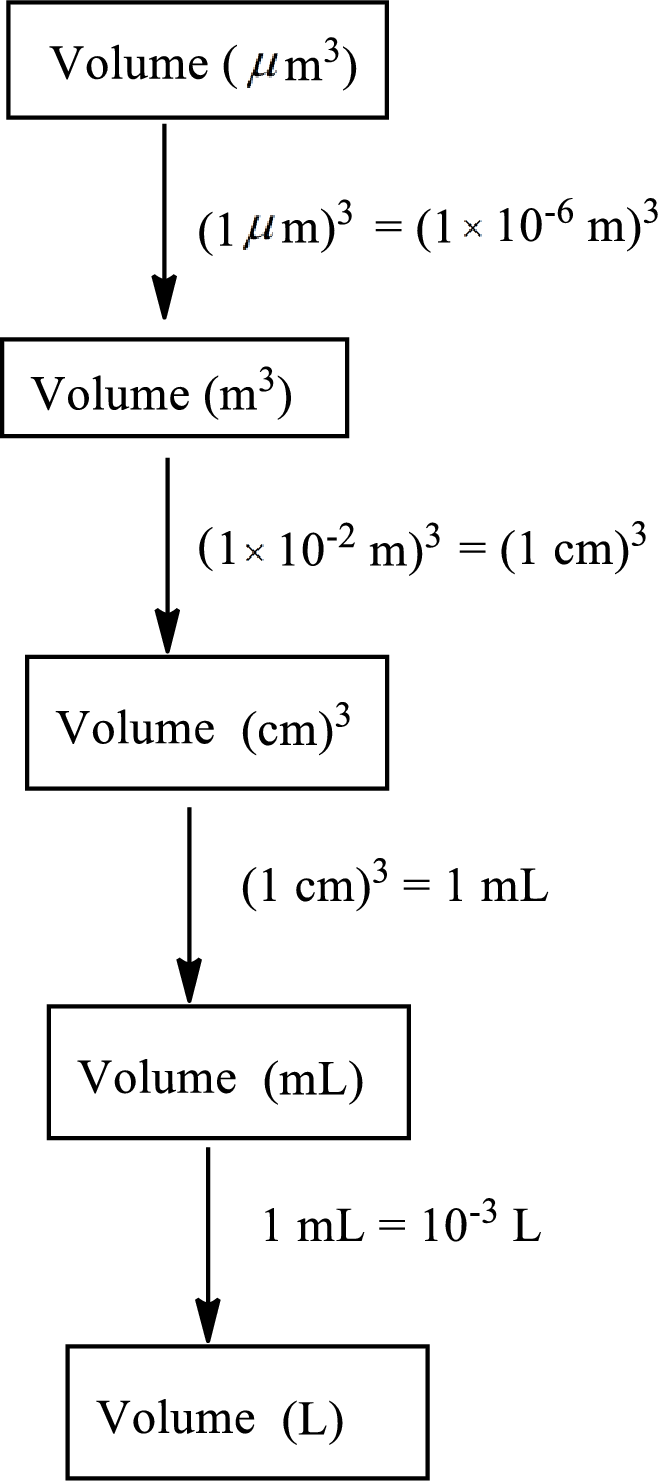
The conversion factor to convert volume from cubic micrometer
The conversion factor to convert volume from cubic meter
The conversion factor to convert volume from cubic centimeters
The conversion factor to convert volume from milliliters
Convert the volume from cubic micrometer
Calculate the volume of
The volume of
Want to see more full solutions like this?
Chapter 1 Solutions
Chemistry: The Molecular Nature of Matter and Change - Standalone book


- Question: Find both the b (gradient) and a (y-intercept) value from the list of data below: (x1 -x̄) 370.5 (y1 - ȳ) 5.240 (x2 - x̄) 142.5 (y2 - ȳ) 2.004 (x3 - x̄) 28.5 (y3 - ȳ) 0.390 (x4 - x̄) -85.5 (y4 - ȳ) -1.231 (x5 - x̄) -199.5 (y5 - ȳ) -2.829 (x6 - x̄) -256.5 (y6 - ȳ) -3.575arrow_forwardCalculating standard reaction free energy from standard reduction... Using standard reduction potentials from the ALEKS Data tab, calculate the standard reaction free energy AG° for the following redox reaction. Be sure your answer has the correct number of significant digits. 3Cu+ (aq) + Cro²¯ (aq) +4H₂O (1) → 3Cu²+ (aq) +Cr(OH)3 (s)+5OH˜¯ (aq) 0 kJ ☐ x10 00. 18 Ararrow_forwardCalculating the pH of a weak base titrated with a strong acid An analytical chemist is titrating 241.7 mL of a 0.4900M solution of methylamine (CH3NH2) with a 0.7800M solution of HNO3. The pK of methylamine is 3.36. Calculate the pH of the base solution after the chemist has added 17.7 mL of the HNO3 solution to it. Note for advanced students: you may assume the final volume equals the initial volume of the solution plus the volume of HNO3 solution added. Round your answer to 2 decimal places. pH = ☑ ? 18 Ararrow_forward
- The following is two groups (Regular tomato sauce & Salt Reduced Tomato Sauce) of data recorded by a team analysising salt content in tomato sauce using the MOHR titration method: Regular Tomato Sauce Salt Reduced Tomato Sauce 223.4 148.7 353.7 278.2 334.6 268.7 305.6 234.4 340.0 262.7 304.3 283.2 244.7 143.6 QUESTION: For both groups of data calculate the answers attached in the image.arrow_forwardThe following is a two groups (Regular tomato sauce & Salt Reduced Tomato Sauce) of data recorded by a team analysising salt content in tomato sauce using the MOHR titration method: Regular Tomato Sauce Salt Reduced Tomato Sauce 340.0mmol/L 262.7mmol/L QUESTION: For both groups (Regular & Salt Reduced tomato sauce) of data provide answers to the following calculations below: 1. Standard Deviation (Sx) 2. T Values (t0.05,4) 3. 95% Confidence Interval (mmol/L) 4. [Na+] (mg/100 mL) 5. 95% Confidence Interval (mg/100 mL)arrow_forwardIf we have leucine (2-amino-4-methylpentanoic acid), alanine (2-aminopropanoic acid) and phenylalanine (2-amino-3-phenylpropanoic acid), indicate the tripeptides that can be formed (use the abbreviated symbols Leu., Ala and Phe).arrow_forward
- Briefly state why trifluoroacetic acid is more acidic than acetic acid.arrow_forwardExplain why acid chlorides are more reactive than amides in reactions with nucleophiles.arrow_forwardCalculating the pH of a weak base titrated with a strong acid An analytical chemist is titrating 101.7 mL of a 0.3500M solution of piperidine (C5H10NH) with a 0.05700M solution of HClO4. The pK of piperidine is 2.89. Calculate the pH of the base solution after the chemist has added 682.9 mL of the HClO solution to it. 4 Note for advanced students: you may assume the final volume equals the initial volume of the solution plus the volume of HClO solution added. 4 Round your answer to 2 decimal places. pH = .11 00. 18 Ararrow_forward
- The following is a two groups (Regular tomato sauce & Salt Reduced Tomato Sauce) of data recorded by a team analysising salt content in tomato sauce using the MOHR titration method: Regular Tomato Sauce Salt Reduced Tomato Sauce 340.0 262.7 QUESTION: For both groups of data provide answers to the calculations attached in the imagearrow_forward7. Concentration and uncertainty in the estimate of concentration (class data) Class mean for sample (Regular) |[Cl-] (mmol/L) class mean Sn za/2 95% Confidence Interval (mmol/L) [Na+] (mg/100 mL) 95% Confidence Interval (mg/100 mL)arrow_forwardThe following is a two groups (Regular tomato sauce & Salt Reduced Tomato Sauce) of data recorded by a team analysising salt content in tomato sauce using the MOHR titration method: Regular Tomato Sauce Salt Reduced Tomato Sauce 223.4 148.7 353.7 278.2 334.6 268.7 305.6 234.4 340.0 262.7 304.3 283.2 244.7 143.6 QUESTION: For both groups of data calculate the answers attached in the image.arrow_forward
 ChemistryChemistryISBN:9781305957404Author:Steven S. Zumdahl, Susan A. Zumdahl, Donald J. DeCostePublisher:Cengage Learning
 ChemistryChemistryISBN:9781259911156Author:Raymond Chang Dr., Jason Overby ProfessorPublisher:McGraw-Hill Education
 Principles of Instrumental AnalysisChemistryISBN:9781305577213Author:Douglas A. Skoog, F. James Holler, Stanley R. CrouchPublisher:Cengage Learning
 Organic ChemistryChemistryISBN:9780078021558Author:Janice Gorzynski Smith Dr.Publisher:McGraw-Hill Education
 Chemistry: Principles and ReactionsChemistryISBN:9781305079373Author:William L. Masterton, Cecile N. HurleyPublisher:Cengage Learning
 Elementary Principles of Chemical Processes, Bind...ChemistryISBN:9781118431221Author:Richard M. Felder, Ronald W. Rousseau, Lisa G. BullardPublisher:WILEY