onsulung grou findings was that 33% of organizations have a coherent business strategy that they stick to and effectively communicate. Suppose another study is conducted to check the validity of this result, with the goal of proving that the percentage is less than 33%. Complete parts (a) and (b) below. a. State the null and research hypotheses. Identify the null and alternative hypotheses. O A. Ho: z20.33; H,: z<0.33 O B. Ho: zS0.33; H;: x> 0.33 OC. Ho: x+0.33; H: =0.33 O D. Ho: z=0.33; H;: z+0.33 b. A sample of 100 organizations is selected, and results indicate that 32 organizations have a coherent business strategy that they stick to and effectively communicate. Use the p-value approach to determine at the 0.01 level of significance whether there is evidence that the percentage is less than 33%. Calculate the test statistic. The test statistic, ZSTAT, is O. (Type an integer or a decimal. Round to two decimal places as needed.) Calculate the p-value. The p-value is (Type an integer or a decimal. Round to three decimal places as needed.) State the conclusion of the test. the null hypothesis. There is V evidence to conclude that the percentage of organizations which have a coherent business strategy that they stick to and effectively communicate is less than 33%.
onsulung grou findings was that 33% of organizations have a coherent business strategy that they stick to and effectively communicate. Suppose another study is conducted to check the validity of this result, with the goal of proving that the percentage is less than 33%. Complete parts (a) and (b) below. a. State the null and research hypotheses. Identify the null and alternative hypotheses. O A. Ho: z20.33; H,: z<0.33 O B. Ho: zS0.33; H;: x> 0.33 OC. Ho: x+0.33; H: =0.33 O D. Ho: z=0.33; H;: z+0.33 b. A sample of 100 organizations is selected, and results indicate that 32 organizations have a coherent business strategy that they stick to and effectively communicate. Use the p-value approach to determine at the 0.01 level of significance whether there is evidence that the percentage is less than 33%. Calculate the test statistic. The test statistic, ZSTAT, is O. (Type an integer or a decimal. Round to two decimal places as needed.) Calculate the p-value. The p-value is (Type an integer or a decimal. Round to three decimal places as needed.) State the conclusion of the test. the null hypothesis. There is V evidence to conclude that the percentage of organizations which have a coherent business strategy that they stick to and effectively communicate is less than 33%.

MATLAB: An Introduction with Applications
6th Edition
ISBN:9781119256830
Author:Amos Gilat
Publisher:Amos Gilat
Chapter1: Starting With Matlab
Section: Chapter Questions
Problem 1P

Related questions
Question
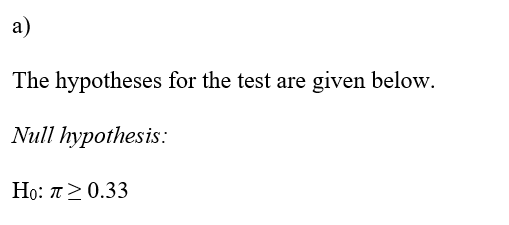
![**Hypothesis Testing on Organizational Strategy**
A consulting group conducted a global survey of product teams to understand better the dynamics of team performance and successful practices. The survey found that 33% of organizations have a coherent business strategy they adhere to and communicate effectively. To validate this finding, another study is proposed to prove the percentage is less than 33%. Complete parts (a) and (b) below.
**a. State the null and research hypotheses.**
Identify the null and alternative hypotheses.
- A. \( H_0: \pi \geq 0.33; \, H_1: \pi < 0.33 \)
- B. \( H_0: \pi \leq 0.33; \, H_1: \pi > 0.33 \)
- C. \( H_0: \pi = 0.33; \, H_1: \pi \neq 0.33 \)
- D. \( H_0: \pi = 0.33; \, H_1: \pi \neq 0.33 \)
**b. A sample of 100 organizations is selected**, and results indicate that 32 organizations have a coherent business strategy that they stick to and effectively communicate. Use the p-value approach to determine at the 0.01 level of significance whether there is evidence that the percentage is less than 33%.
Calculate the test statistic.
The test statistic, \( Z_{STAT} \), is \( \Box \).
(Type an integer or a decimal. Round to two decimal places as needed.)
Calculate the p-value.
The p-value is \( \Box \).
(Type an integer or a decimal. Round to three decimal places as needed.)
State the conclusion of the test.
\[ \Box \] the null hypothesis. There is \( \Box \) evidence to conclude that the percentage of organizations which have a coherent business strategy that they stick to and effectively communicate is less than 33%.](/v2/_next/image?url=https%3A%2F%2Fcontent.bartleby.com%2Fqna-images%2Fquestion%2F0a63f6a7-ec54-4c0e-abf5-810ded572838%2Fbe4b2d54-97e6-47f2-a236-043ed920237e%2F6o4toqq_processed.png&w=3840&q=75)
Transcribed Image Text:**Hypothesis Testing on Organizational Strategy**
A consulting group conducted a global survey of product teams to understand better the dynamics of team performance and successful practices. The survey found that 33% of organizations have a coherent business strategy they adhere to and communicate effectively. To validate this finding, another study is proposed to prove the percentage is less than 33%. Complete parts (a) and (b) below.
**a. State the null and research hypotheses.**
Identify the null and alternative hypotheses.
- A. \( H_0: \pi \geq 0.33; \, H_1: \pi < 0.33 \)
- B. \( H_0: \pi \leq 0.33; \, H_1: \pi > 0.33 \)
- C. \( H_0: \pi = 0.33; \, H_1: \pi \neq 0.33 \)
- D. \( H_0: \pi = 0.33; \, H_1: \pi \neq 0.33 \)
**b. A sample of 100 organizations is selected**, and results indicate that 32 organizations have a coherent business strategy that they stick to and effectively communicate. Use the p-value approach to determine at the 0.01 level of significance whether there is evidence that the percentage is less than 33%.
Calculate the test statistic.
The test statistic, \( Z_{STAT} \), is \( \Box \).
(Type an integer or a decimal. Round to two decimal places as needed.)
Calculate the p-value.
The p-value is \( \Box \).
(Type an integer or a decimal. Round to three decimal places as needed.)
State the conclusion of the test.
\[ \Box \] the null hypothesis. There is \( \Box \) evidence to conclude that the percentage of organizations which have a coherent business strategy that they stick to and effectively communicate is less than 33%.
Expert Solution
Step 1

Step by step
Solved in 2 steps with 3 images

Recommended textbooks for you
MATLAB: An Introduction with Applications
Statistics
ISBN:
9781119256830
Author:
Amos Gilat
Publisher:
John Wiley & Sons Inc

Probability and Statistics for Engineering and th…
Statistics
ISBN:
9781305251809
Author:
Jay L. Devore
Publisher:
Cengage Learning

Statistics for The Behavioral Sciences (MindTap C…
Statistics
ISBN:
9781305504912
Author:
Frederick J Gravetter, Larry B. Wallnau
Publisher:
Cengage Learning
MATLAB: An Introduction with Applications
Statistics
ISBN:
9781119256830
Author:
Amos Gilat
Publisher:
John Wiley & Sons Inc
Probability and Statistics for Engineering and th…
Statistics
ISBN:
9781305251809
Author:
Jay L. Devore
Publisher:
Cengage Learning
Statistics for The Behavioral Sciences (MindTap C…
Statistics
ISBN:
9781305504912
Author:
Frederick J Gravetter, Larry B. Wallnau
Publisher:
Cengage Learning

Elementary Statistics: Picturing the World (7th E…
Statistics
ISBN:
9780134683416
Author:
Ron Larson, Betsy Farber
Publisher:
PEARSON

The Basic Practice of Statistics
Statistics
ISBN:
9781319042578
Author:
David S. Moore, William I. Notz, Michael A. Fligner
Publisher:
W. H. Freeman

Introduction to the Practice of Statistics
Statistics
ISBN:
9781319013387
Author:
David S. Moore, George P. McCabe, Bruce A. Craig
Publisher:
W. H. Freeman