Employee A random sample of companies in electric utilities (I), financial services (II), and food processing (III) gave the following information regarding annual profits per employee (units in thousands of dollars). I II III 49.1 55.6 39.0 43.4 25.0 37.3 32.9 41.3 10.8 27.8 29.9 32.5 38.3 39.5 15.8 36.1 42.6 20.2 Shall we reject or not reject the claim that there is no difference in population mean annual profits per employee in each of the three types of companies? Use a 1% level of significance. Assume that the distributions are normal and have approximately the same population standard deviation. What is the level of significance? State the null and alternate hypotheses. Find SSTOT, SSBET, and SSW and check that SSTOT = SSBET + and SSW. Find d.f.BET, d.f.W, MSBET and MSW. Find the value of the sample test statistic F (F ratio). What are the degrees of freedom? Find (or estimate) the P-value of the sample test statistic. Based on your answers in parts (1), (2), and (3), will you reject or fail to reject the null hypothesis? Make a summary table for your ANOVA test.


Employee A random sample of companies in electric utilities (I), financial services (II), and food processing (III) gave the following information regarding annual profits per employee (units in thousands of dollars).
|
I |
II |
III |
|
49.1 |
55.6 |
39.0 |
|
43.4 |
25.0 |
37.3 |
|
32.9 |
41.3 |
10.8 |
|
27.8 |
29.9 |
32.5 |
|
38.3 |
39.5 |
15.8 |
|
36.1 |
42.6 |
|
|
20.2 |
Shall we reject or not reject the claim that there is no difference in population mean annual profits per employee in each of the three types of companies? Use a 1% level of significance. Assume that the distributions are normal and have approximately the same population standard deviation.
- What is the level of significance? State the null and alternate hypotheses.
- Find SSTOT, SSBET, and SSW and check that SSTOT = SSBET + and SSW. Find d.f.BET, d.f.W, MSBET and MSW. Find the value of the sample test statistic F (F ratio). What are the degrees of freedom?
- Find (or estimate) the P-value of the sample test statistic.
- Based on your answers in parts (1), (2), and (3), will you reject or fail to reject the null hypothesis?
- Make a summary table for your ANOVA test.
Part 1:
The level of significance is 0.01.
The null and alternate hypothesis are,
H0: μ1 = μ2 = μ3 = 0
H1: at least one μi ≠ 0
We reject the null hypothesis if F-value > F-critical value.
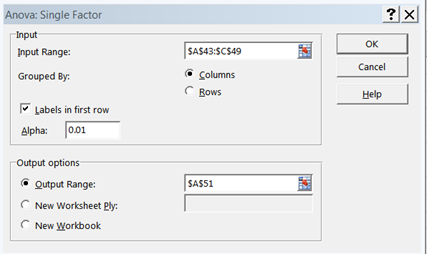
We perform ANOVA using the step by step procedure in excel as below:
- Enter the data into excel sheet.
- Go to Data > Data Analysis > Anova: Single factor > Click OK.
- Enter the input range and other values as given in the dialogue below and click OK.

Step by step
Solved in 3 steps with 2 images


