A random ampie of companies in electric ues (, fnancal services (m, and food processing gve the floing inturmaton regarding annl profts per employe (unita in thousands of dea. 29. Shalwereet or net rect he cam that theresne amrence in pepuan mean annual profts per empleyee in each ot the tree types of companies usea evel of ticance ( whatthe levelof ance State the nuand atemate hypotheses OM My: A east te meansa OM My: Nat alhe mean OM My: A tee mee erent OM , taty t meanse e ) Fnd Son annd 55 and check that Sor Ser * e3 decimal paces) Ped a a ennd s e3 decomal paces for se nd s the value of the amplea e3 decima degrees of eedem ommertar) |coenominatar so Fnd hePeof he sample test sa decimal paces) ) Baned on your anesin parta (a) te . you reject or fal to O Snce the P greater than the level of vticance t O Since the Pvalesless than or eal te the levelofsigticance ate.0s, eret the nul hypthe ot reject O Since theP value greater than the level f cance at 0.05, we regect O Since the Pvaleless than or equalto the level ofsgticance at0.05, not reect
A random ampie of companies in electric ues (, fnancal services (m, and food processing gve the floing inturmaton regarding annl profts per employe (unita in thousands of dea. 29. Shalwereet or net rect he cam that theresne amrence in pepuan mean annual profts per empleyee in each ot the tree types of companies usea evel of ticance ( whatthe levelof ance State the nuand atemate hypotheses OM My: A east te meansa OM My: Nat alhe mean OM My: A tee mee erent OM , taty t meanse e ) Fnd Son annd 55 and check that Sor Ser * e3 decimal paces) Ped a a ennd s e3 decomal paces for se nd s the value of the amplea e3 decima degrees of eedem ommertar) |coenominatar so Fnd hePeof he sample test sa decimal paces) ) Baned on your anesin parta (a) te . you reject or fal to O Snce the P greater than the level of vticance t O Since the Pvalesless than or eal te the levelofsigticance ate.0s, eret the nul hypthe ot reject O Since theP value greater than the level f cance at 0.05, we regect O Since the Pvaleless than or equalto the level ofsgticance at0.05, not reect

MATLAB: An Introduction with Applications
6th Edition
ISBN:9781119256830
Author:Amos Gilat
Publisher:Amos Gilat
Chapter1: Starting With Matlab
Section: Chapter Questions
Problem 1P

Related questions
Question

Transcribed Image Text:A random sample of companies in electric utilities (I), financial services (II), and food processing (III) gave the following information regarding annual profits per employee (units in thousands of dollars).
I
II
III
49.4
55.5
39.1
43.1
24.5
37.8
32.2
41.8
10.7
27.9
29.9
32.5
38.9
39.4
15.5
36.7
42.7
20.8
Shall we reject or not reject the claim that there is no difference in population mean annual profits per employee in each of the three types of companies? Use a 5% level of significance.
(a) What is the level of significance?
State the null and alternate hypotheses.
O H,: H1 = H2 = H3i H;: At least two means are equal.
O H,: H1 = H2 = H3; H;: Not all the means are equal.
O H.: H1 = H2 = H3; H;: All three means are different.
O H.: H1 = H2 = H3i H;: Exactly two means are equal.
(b) Find SSTOT, SSBET, and SSw and check that SSTOT = SSBET + SSw. (Use 3 decimal places.)
SSTOT =
SSBET =
SSw=C
Find d.f. BET, d.f. w, MSBET, and MSw. (Use 3 decimal places for MSBET, and MSw:)
dfBET =
dfw=|
MS BET =
MSw=
Find the value of the sample F statistic. (Use 3 decimal places.)
What are the degrees of freedom?
(numerator)
(denominator)
(c) Find the P-value of the sample test statistic. (Use 4 decimal places.)
(d) Based on your answers in parts (a) to (c), will you reject or fail to reject the null hypothesis?
O Since the P value is greater than the level of significance at a = 0.05, we do not reject Ho:
O Since the P value is less than or equal to the level of significance at a = 0.05, we reject Ho.
O Since the P value is greater than the level of significance at a = 0.05, we reject Ho.
O Since the P value is less than or equal to the level of significance at a = 0.05, we do not reject Ho.
(e) Interpret your conclusion in the context of the application.
O At the 5% level of significance there is insufficient evidence to conclude that the means are not all equal.
O At the 5% level of significance there is sufficient evidence to conclude that the means are all equal.
O At the 5% level of significance there is insufficient evidence to conclude that the means are all equal.
O At the 5% level of significance there is sufficient evidence to conclude that the means are not all equal.
(f) Make a summary table for your ANOVA test.
Source of
Degrees of
Freedom
Sum of
F
Test
MS
P Valu
Variation
Squares
Ratio
Decision
Between groups
---Select---
Within groups
Total
Expert Solution
Step 1
Hello! As you have posted more than 3 sub parts, we are answering the first 3 sub-parts. In case you require the unanswered parts also, kindly re-post that parts separately.
Excel Procedure:
Enter the data for I, II and III in Excel sheet>Go to Data Menu>Click on Data Analysis>Select ‘Anova: single factor’ and click on ‘OK’>Select the data under ‘input range’>Click on ‘OK’.
Excel Output:
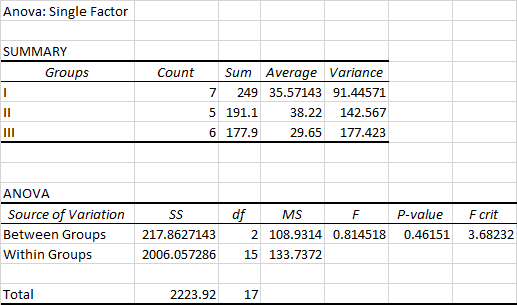
Given that the level of significance is 5%.
The level of significance is 5%=0.05

Step by step
Solved in 2 steps with 1 images

Recommended textbooks for you
MATLAB: An Introduction with Applications
Statistics
ISBN:
9781119256830
Author:
Amos Gilat
Publisher:
John Wiley & Sons Inc

Probability and Statistics for Engineering and th…
Statistics
ISBN:
9781305251809
Author:
Jay L. Devore
Publisher:
Cengage Learning

Statistics for The Behavioral Sciences (MindTap C…
Statistics
ISBN:
9781305504912
Author:
Frederick J Gravetter, Larry B. Wallnau
Publisher:
Cengage Learning
MATLAB: An Introduction with Applications
Statistics
ISBN:
9781119256830
Author:
Amos Gilat
Publisher:
John Wiley & Sons Inc
Probability and Statistics for Engineering and th…
Statistics
ISBN:
9781305251809
Author:
Jay L. Devore
Publisher:
Cengage Learning
Statistics for The Behavioral Sciences (MindTap C…
Statistics
ISBN:
9781305504912
Author:
Frederick J Gravetter, Larry B. Wallnau
Publisher:
Cengage Learning

Elementary Statistics: Picturing the World (7th E…
Statistics
ISBN:
9780134683416
Author:
Ron Larson, Betsy Farber
Publisher:
PEARSON

The Basic Practice of Statistics
Statistics
ISBN:
9781319042578
Author:
David S. Moore, William I. Notz, Michael A. Fligner
Publisher:
W. H. Freeman

Introduction to the Practice of Statistics
Statistics
ISBN:
9781319013387
Author:
David S. Moore, George P. McCabe, Bruce A. Craig
Publisher:
W. H. Freeman