As the manager of a fashion brand, you have recently run a large-scale campaign to draw attent your company's CSR activities and thus improve the brand's image. In order to evaluate the effi of the campaign, you conducted a survey at major fashion stores to measure the attitudes towa your brand at two points of time: before the campaign started and after the campaign finished... summing up respondents' answers to 3 questions (each measuring a particular aspect of attituc a 1-5 scale), a single overall measure of attitude is obtained for each participant. This measure therefore range from 3 to 15, with a score of 3 representing and extremely negative attitude an score of 15 representing an extremely positive attitude. To check whether male and female customers have different attitudes towards you company, as well as to test whether the campa may have affected males and females differently, you ask the respondents to report their gende You analyse the data gathered in the two surveys in SPSS. The output is shown below.
As the manager of a fashion brand, you have recently run a large-scale campaign to draw attent your company's CSR activities and thus improve the brand's image. In order to evaluate the effi of the campaign, you conducted a survey at major fashion stores to measure the attitudes towa your brand at two points of time: before the campaign started and after the campaign finished... summing up respondents' answers to 3 questions (each measuring a particular aspect of attituc a 1-5 scale), a single overall measure of attitude is obtained for each participant. This measure therefore range from 3 to 15, with a score of 3 representing and extremely negative attitude an score of 15 representing an extremely positive attitude. To check whether male and female customers have different attitudes towards you company, as well as to test whether the campa may have affected males and females differently, you ask the respondents to report their gende You analyse the data gathered in the two surveys in SPSS. The output is shown below.

MATLAB: An Introduction with Applications
6th Edition
ISBN:9781119256830
Author:Amos Gilat
Publisher:Amos Gilat
Chapter1: Starting With Matlab
Section: Chapter Questions
Problem 1P

Related questions
Question

Transcribed Image Text:As the manager of a fashion brand, you have recently run a large-scale campaign to draw attention to
your company's CSR activities and thus improve the brand's image. In order to evaluate the efficiency
of the campaign, you conducted a survey at major fashion stores to measure the attitudes towards.
your brand at two points of time: before the campaign started and after the campaign finished. By
summing up respondents' answers to 3 questions (each measuring a particular aspect of attitude on
a 1-5 scale), a single overall measure of attitude is obtained for each participant. This measure can
therefore range from 3 to 15, with a score of 3 representing and extremely negative attitude and a
score of 15 representing an extremely positive attitude. To check whether male and female
customers have different attitudes towards you company, as well as to test whether the campaign
may have affected males and females differently, you ask the respondents to report their gender.
You analyse the data gathered in the two surveys in SPSS. The output is shown below.
Dependent Variable: Attitude
Time Gender Mean
before female
male
Total
female
male
Total
female
male
Total
after
Descriptive Statistics
Total
Source
Corrected Model
11.28
11.02
11.15
11.84
11.69
11.77
11.56
11.36
11.46
Intercept
Time
Gender
Time Gender
Erron
Total
Std. Deviation
2.307
2.250
2.278
2.203
2.096
2.147
2.269
2.195
2.233
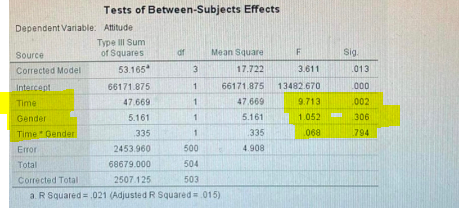
Dependent Variable: Attitude
Type III Sum
of Squares
53.165
66171.875
47.669
5.161
.335
df
Tests of Between-Subjects Effects
3
1
1
1
1
500
504
503
N
126
126
252
126
126
252
252
2453.960
68679.000
Corrected Total
2507.125
a. R Squared= .021 (Adjusted R Squared= .015)
252
504
Mean Square
17.722
66171.875
47.669
5.161
335
4.908
F
3.611
13482.670
9.713
1.052
068
Sig.
013
000
002
306
794
Conduct all necessary statistical tests at .05 level of significance, and fully interpret the results.
Expert Solution
Step 1
Consider the partial output of SPSS
The level of significance is,
Decision rule:
Reject the null hypothesis and conclude that the means are significant if p-value is less than 0.05

Step by step
Solved in 4 steps with 1 images

Recommended textbooks for you
MATLAB: An Introduction with Applications
Statistics
ISBN:
9781119256830
Author:
Amos Gilat
Publisher:
John Wiley & Sons Inc

Probability and Statistics for Engineering and th…
Statistics
ISBN:
9781305251809
Author:
Jay L. Devore
Publisher:
Cengage Learning

Statistics for The Behavioral Sciences (MindTap C…
Statistics
ISBN:
9781305504912
Author:
Frederick J Gravetter, Larry B. Wallnau
Publisher:
Cengage Learning
MATLAB: An Introduction with Applications
Statistics
ISBN:
9781119256830
Author:
Amos Gilat
Publisher:
John Wiley & Sons Inc
Probability and Statistics for Engineering and th…
Statistics
ISBN:
9781305251809
Author:
Jay L. Devore
Publisher:
Cengage Learning
Statistics for The Behavioral Sciences (MindTap C…
Statistics
ISBN:
9781305504912
Author:
Frederick J Gravetter, Larry B. Wallnau
Publisher:
Cengage Learning

Elementary Statistics: Picturing the World (7th E…
Statistics
ISBN:
9780134683416
Author:
Ron Larson, Betsy Farber
Publisher:
PEARSON

The Basic Practice of Statistics
Statistics
ISBN:
9781319042578
Author:
David S. Moore, William I. Notz, Michael A. Fligner
Publisher:
W. H. Freeman

Introduction to the Practice of Statistics
Statistics
ISBN:
9781319013387
Author:
David S. Moore, George P. McCabe, Bruce A. Craig
Publisher:
W. H. Freeman