A doctor wants to test if a patient should be diagnosed with diabetes based on their blood results and if their gender plays a role in the situation. There is a total of 22 patients, 11 of them being women and 11 men, but there are only enough diabetes blood tests for 10 patients. For this randomized block design, we can randomly choose 5 men and 5 women to receive testing and the other 6 men and 6 women will receive a placebo and in this case the placebo would be a different form of diabetes testing such as a glucose monitoring system. Toward the end, you can collect blood glucose levels from both groups and determine which one seems to be more accurate. The mean for the data set would be 135.87 and the standard deviation would be 4.71.


A doctor wants to test if a patient should be diagnosed with diabetes based on their blood results and if their gender plays a role in the situation. There is a total of 22 patients, 11 of them being women and 11 men, but there are only enough diabetes blood tests for 10 patients. For this randomized block design, we can randomly choose 5 men and 5 women to receive testing and the other 6 men and 6 women will receive a placebo and in this case the placebo would be a different form of diabetes testing such as a glucose monitoring system. Toward the end, you can collect blood glucose levels from both groups and determine which one seems to be more accurate. The mean for the data set would be 135.87 and the standard deviation would be 4.71.
- Create a formal statement of the null and alternative hypothesis for your test. Make sure to include correct statistical notation for the formal null and alternative, do not just state this in words. *T-test is right tailed*
- State a confidence
interval for estimating the parameter in your test. State and discuss your chosen confidence level, why this is appropriate, and interpret the lower and upper limits. (Mean: 135.87 ; Standard deviation: 4.71 ; N: 22 ; Confidence interval: 1.96 ; Margin of error: 1.96895 ; Upper bound; 137.84 ; Lower bound: 133.90) - An interpretation of your p-value and confidence interval, including what they mean in the context of your experimental design. Answer each part below. State your significance level, interpret your p-value, and make a decision on the null.
1)
The hypotheses are given below:
Null hypothesis:
H0: μt1 = μt 2
That is, there is no significant difference between the treatments.
Alternative hypothesis:
H1: There is a significant difference between the treatments.
Null hypothesis:
H0: μb1 = μb 2
That is, there is no significant difference between the Blocks.
Alternative hypothesis:
H1: There is a significant difference between the Blocks.
Null hypothesis:
H0: There is no interaction effect between the treatment and Blocks.
Alternative hypothesis:
H1: There is an interaction effect between the treatment and Blocks.
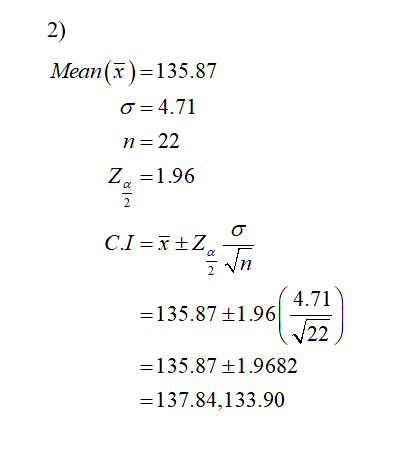
The upper limit is 137.84.
The lower limit is 133.90.

Trending now
This is a popular solution!

Step by step
Solved in 3 steps with 1 images


